Smith’s favorite apps and working with Vibe
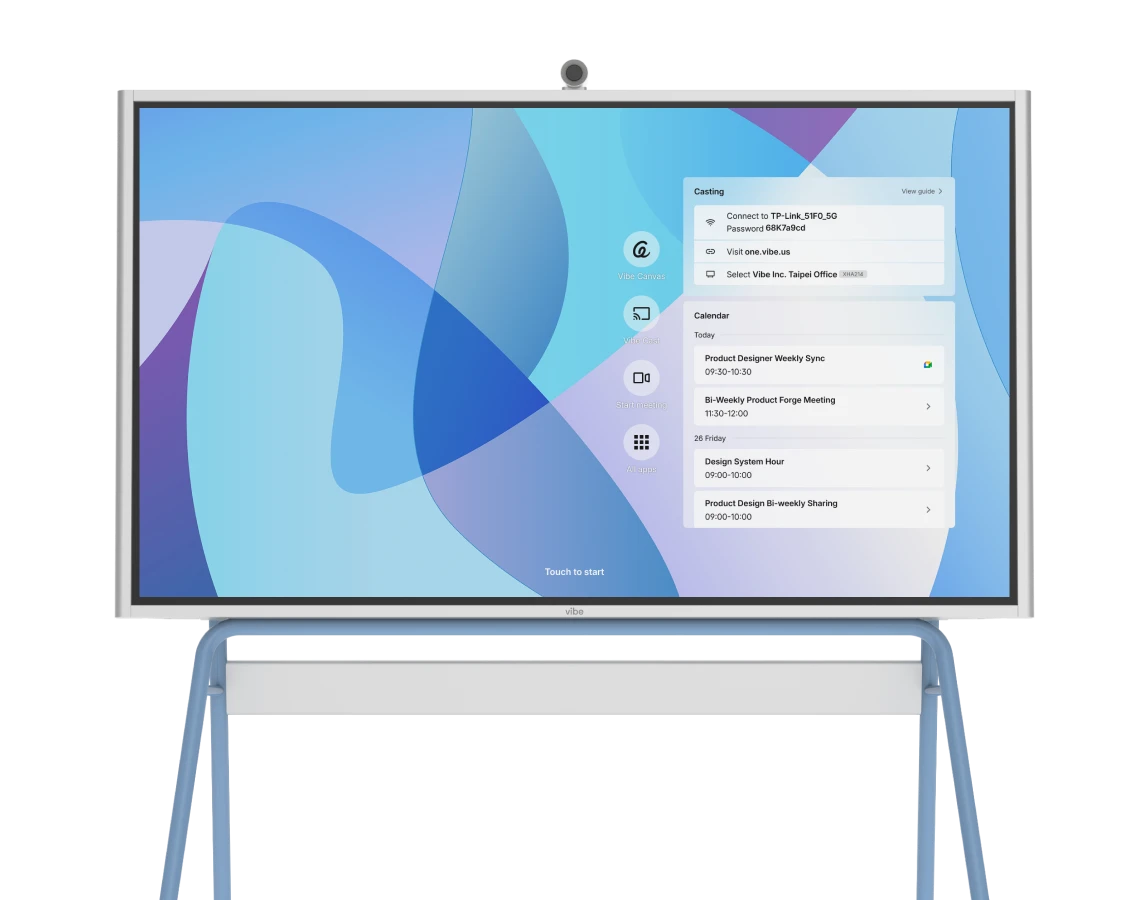
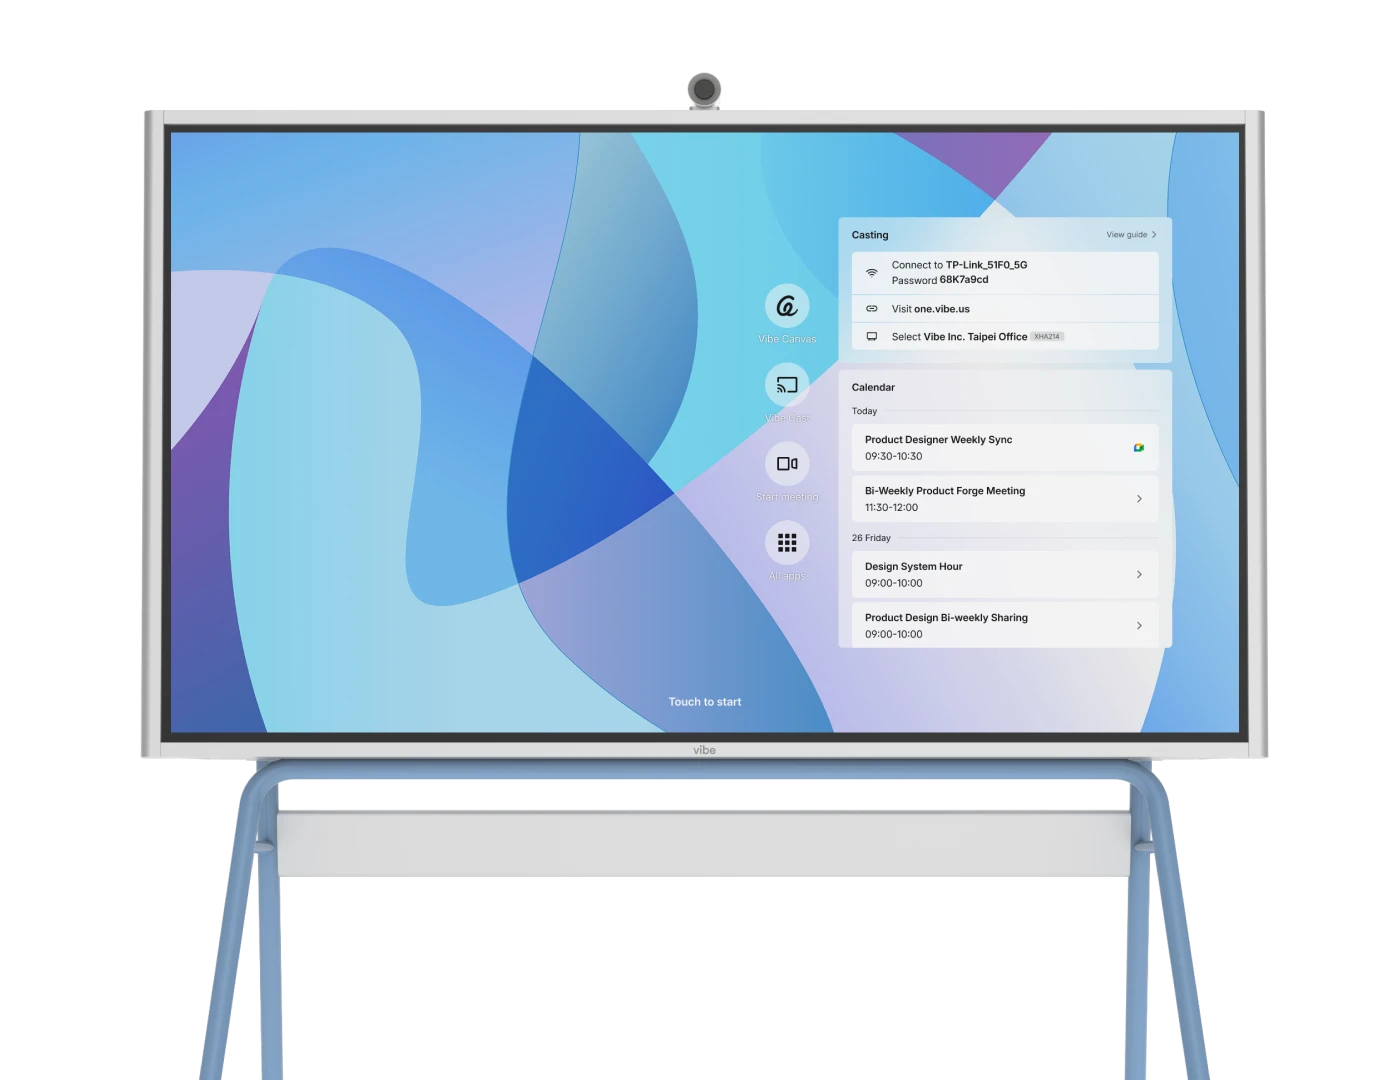
Smith uses a trio of tools for most of his work: Zoom, Google Docs, and the Vibe Board’s infinite canvas. The board lets him easily access the tools that already work well for him so that he can confidently lead his teams through projects. He’s even developed a process for large team brainstorming sessions using one of his go-to features, Vibe’s sticky notes.
"What the Vibe Board allows me to do is compile, in a single place, the documentation of a project," he says. "If I put people into breakout groups in Zoom, each group can work on a different page of the same Vibe Board together. They’ll start with their sticky notes to work through and brainstorm some things, then we’ll reconstitute the groups and they can still work with the same notes and move them to different places [on the board’s canvas]."
With so many people currently working remotely, keeping teams engaged during virtual meetings is imperative. Giving everyone access to the same documents is one thing. But Smith found that providing the opportunity to collaborate on the document in real time keeps them engaged, especially when creating PICK charts.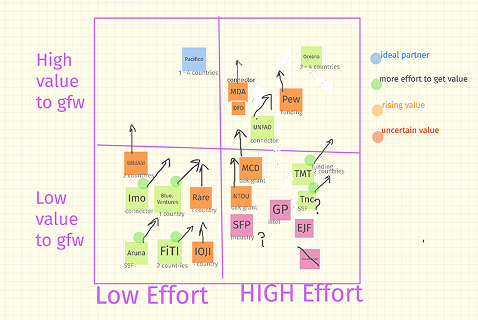 "Let’s say I have 20 sticky notes [with projects on them], then describe what the median line is, and we’ll move all those notes above the median. The bottom of the chart will become low impact. Then, we draw a vertical line on the Vibe Board and say, ‘Those projects that are high impact and high cost are going to move to the right of the line,’ and the low cost will move to the left," he explains. "You’re left with four quadrants of notes and can quickly say, ‘Here are the priority projects because they’re high return and low cost.’ You can graphically represent that. It’s the same exercise we could do in a live room, but this replicates that live room."
Customized onboarding plans for clients
This same trio of tools makes it easy for Smith to prep groups for what they’ll be using in that day’s meeting. He creates a custom Zoom video for each client to review the tools and explain what they’ll need to practice.
"I’ll say, ‘We’re going to be using Zoom. If you haven’t used Zoom before, here are the things you should know. We’re going to be using Google Docs. Here’s the link to the doc; if you haven’t used Google Docs before, here’s what you should know. Please go in and play with it.’ And I set up a Vibe Board beforehand and give them access and say, ‘Here’s this table, it has your name in it; please go in and populate it with your expectations,’ then they’ve practiced with it and know how it works."
This method not only encourages collaboration, it also gives his clients time to practice and get comfortable with the programs.
"What I’ve found is the more sophisticated a client is in terms of tools, the more likely they are to actually go in and play with it. For example, I invited one client of mine into a Vibe Board and said, ‘Go practice some things, it’s pretty intuitive.’ The next thing I know they’re importing pictures, they’ve got their team picture in there, they’ve got their logo in there, they’re writing hi to each other because they’re in different places," he said with a laugh.Leading large meetings and group collaborations
Smith has found that the preferred video conferencing platform varies among his roster of clients. Luckily, the Vibe Board is compatible with several popular meeting platforms. This flexibility made Smith’s life easier during a recent session with a large Fortune 100 company.
"This company uses Webex as their platform, but we were able to use my Zoom license and have 250 people at the meeting," he said. "With 250 people working to collaborate, you need to get creative in terms of what you can do. I can create up to 50 different breakout rooms with Zoom, so now I can have four people in each room and they can actually do something on a page of the Vibe Board and collaborate."
And since the canvas is a living document that can be annotated and altered as needed, Smith can easily review group work. "We can say, ‘Let’s see what you guys came up with,’ and go to the Vibe Board and say, ‘Here’s group one, group two, group three.’" He acknowledges that it takes a lot of preparation to make the flow of a virtual meeting feel seamless, and that being able to prepare beforehand with the Vibe Board is important.
Large teams with multi-part projects have a lot to keep track of, but Smith found solution for that situation, too.
"This team put all of their different projects on a board, and they wanted a way to stay better connected with each other. So, they wrote their initials on a project’s individual sticky note if it was something they wanted to stay informed on. We then moved the information to a Google Doc so that we could cross-reference in there." Getting the team involved and being able to use tools they’re comfortable with leads to all kinds of creative solutions.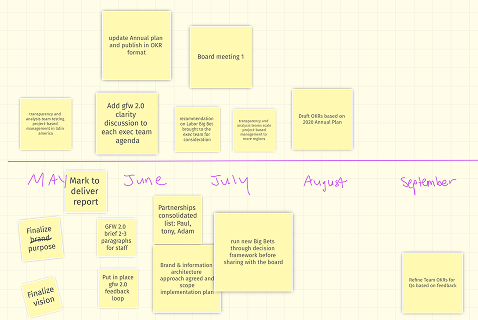
Smith’s favorite Vibe features
The Vibe Board’s functionality and intuitive design make it easy for Mark to go into the apps menu and try out new-to-him programs. The ever-growing list of app integrations keeps things interesting, too. Smith is always curious to see what else might be available to work alongside his must-have tools.
But beyond the library of apps, Smith appreciates how Vibe lets his teams work together, even across different time zones. He said, "What’s really cool on the Vibe Board is the asynchronous side of it. I can leave a session and say, ‘Before tomorrow, reorganize your ideas into these three categories.’ Often they’ll go in and reorganize asynchronously, and then we can go back in and we’re sharing the same document.
"The way I talk about it is, we can work at the same time, same place; same time, different place; different time, different place; or we could work different time, same place if we wanted to share one physical board. The Vibe Board creates those different opportunities so you can work asynchronously, but it’s all coming together in one place."
He also listed the continuous canvas as a plus for collaboration. Specifically, it makes it easy for everyone to put their ideas on the board before they all dive in to shape the ideas and move things around before moving on to the next activity.Using Vibe outside of work
Now that he’s been using Vibe, Smith has found that the board serves multiple areas of his life. In addition to client work and collaboration projects, he uses the Netflix integration when taking a break from work. He uses Vibe for coursework as well.
"I’m working on my doctorate right now and one of the things we have to do is watch a couple of video lessons. I just cast the video from my laptop to the Vibe Board so I can work on things while I’m watching the lessons."
Ultimately, Smith described the board as "a collaboration tool that is especially useful for people working in parallel, as opposed to those who are all working in the same room." This functionality is key as more companies explore various work-from-home arrangements.
And just as Smith encourages his clients and teams to play around with the various apps and tools available to them, he has also found that his preferences with the Vibe Board have come through trial and error.
"What I’ve learned is, don’t try to use the board for everything. Use it where it makes the most sense. And the more you prep in advance for how you’re going to use it, the more successful you’ll be."
Based on all of the different ways Mark has incorporated the Vibe Board into his daily work, it seems as though he’s found plenty of opportunities where turning to Vibe makes the most sense.