One board, one decision
Growing fast, with no signs of slowingShawn Dalton, Sundt's technology services manager, found Vibe the same way a lot of early adopters do: through a Facebook ad.
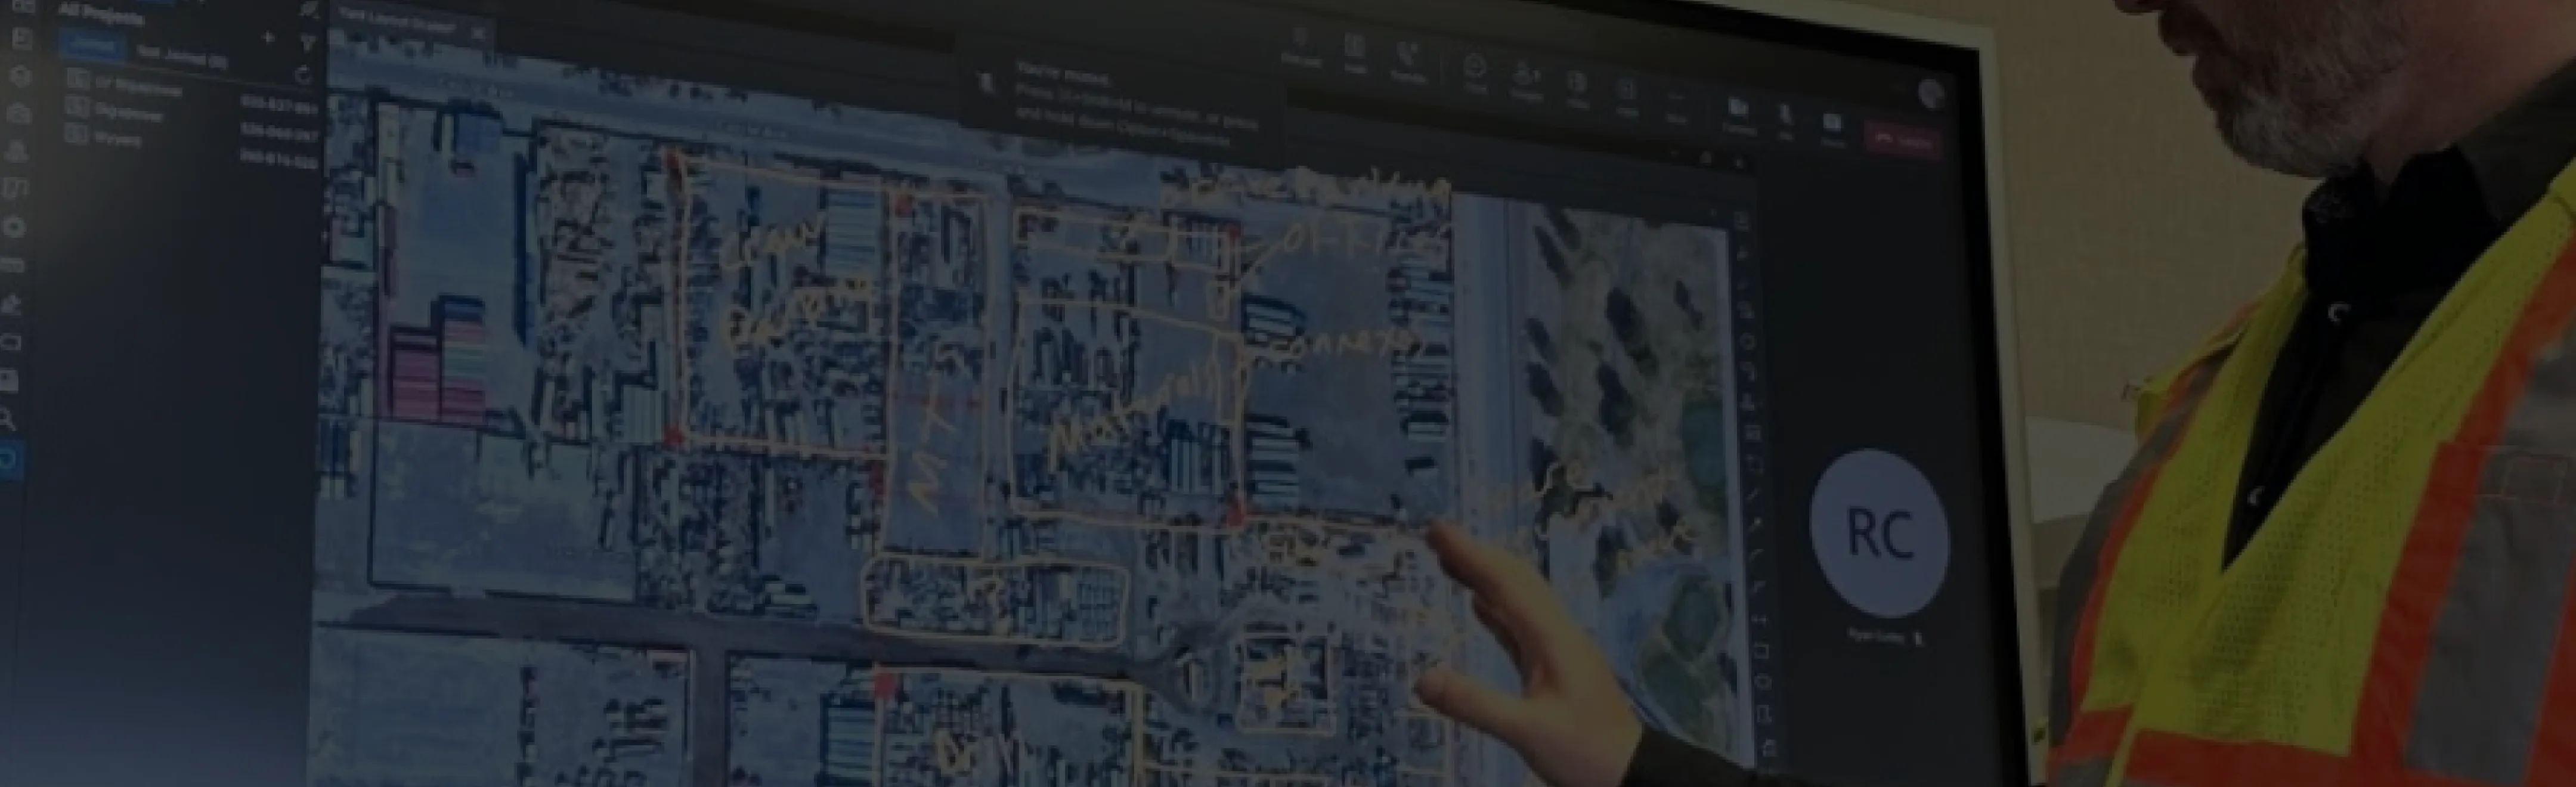
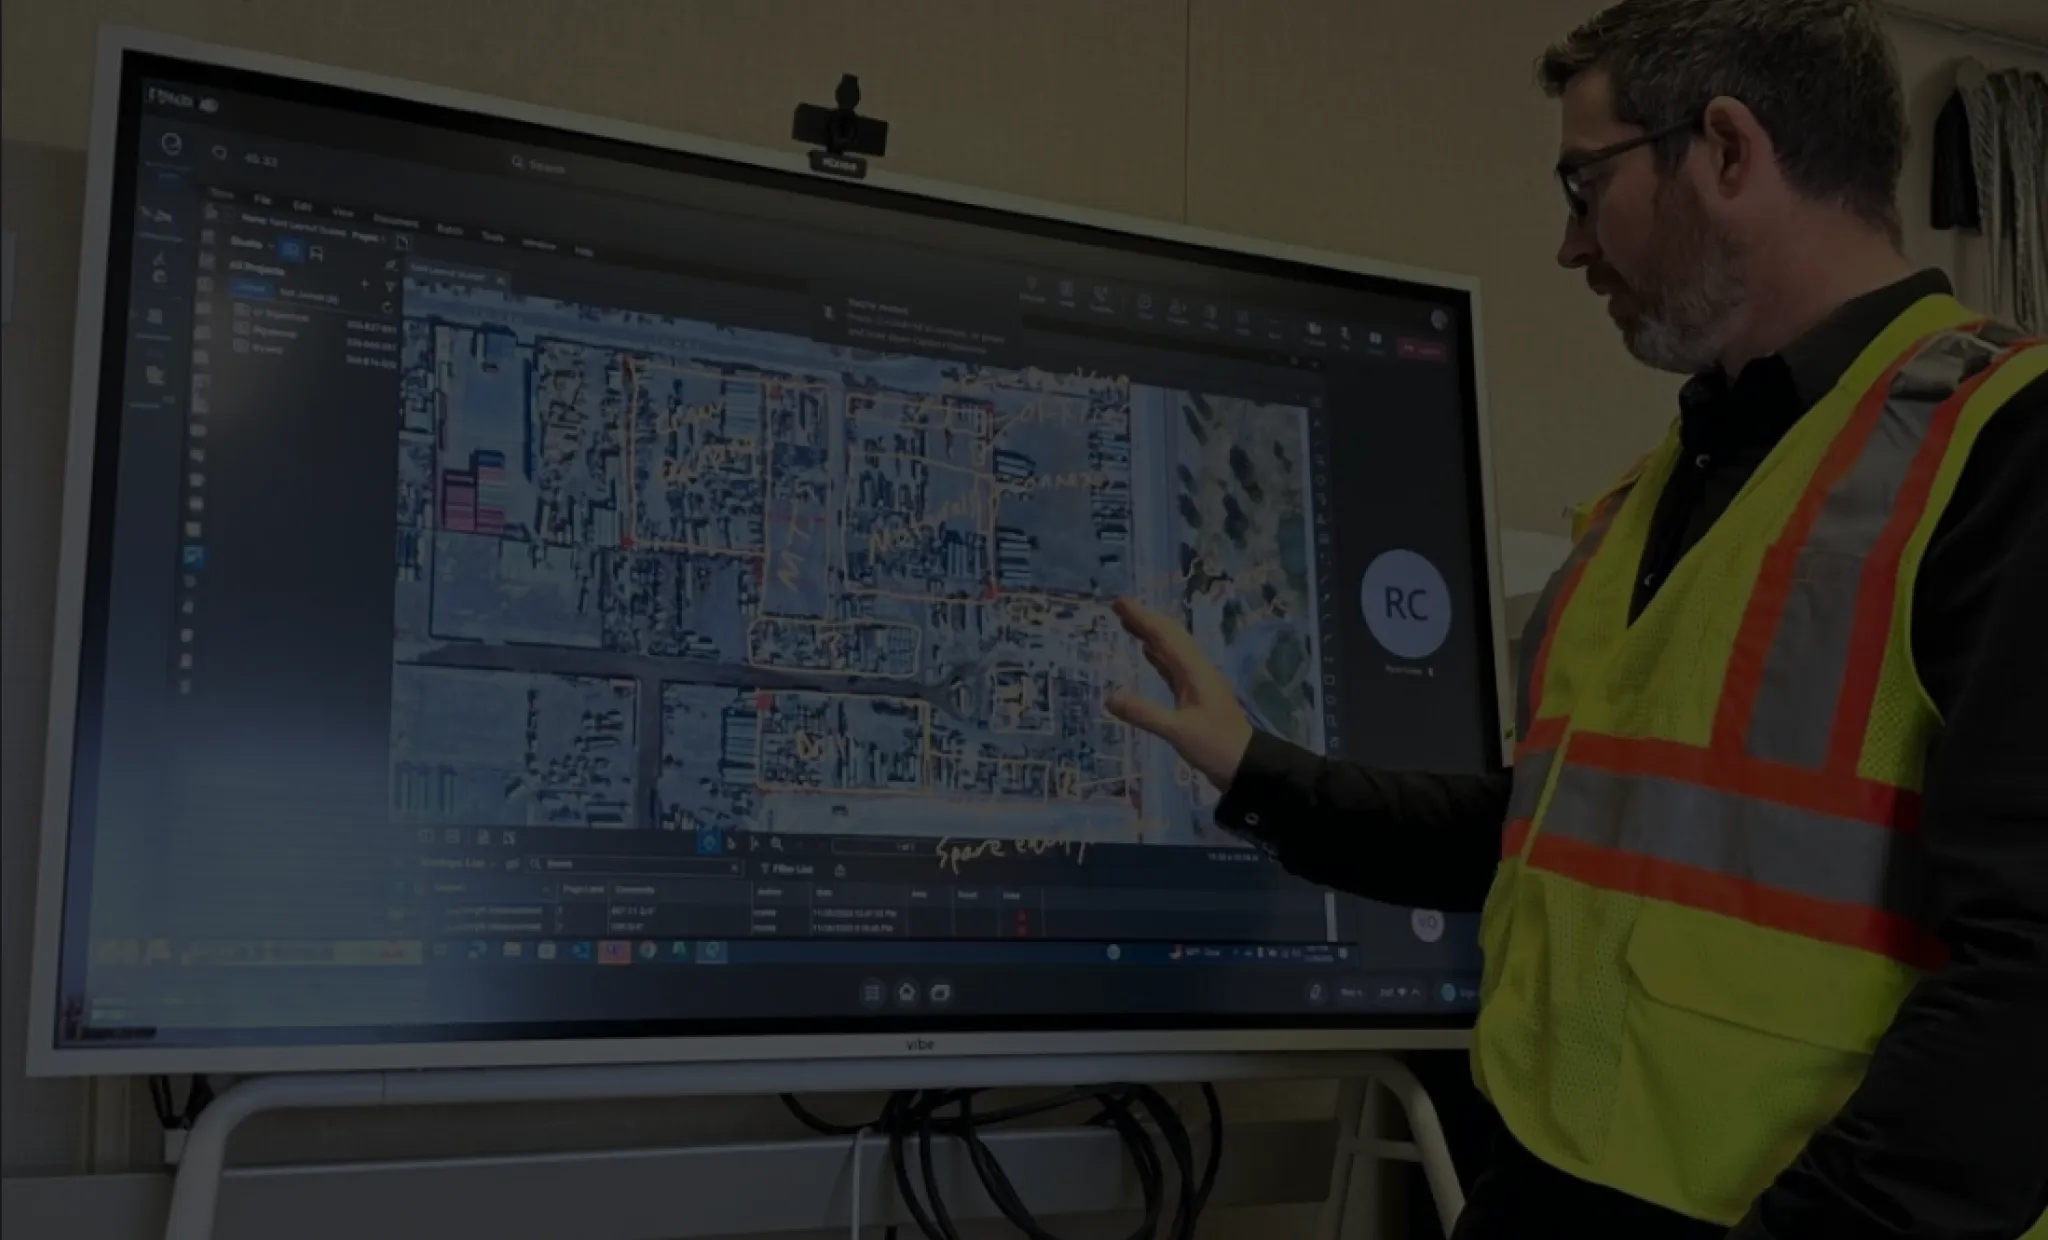
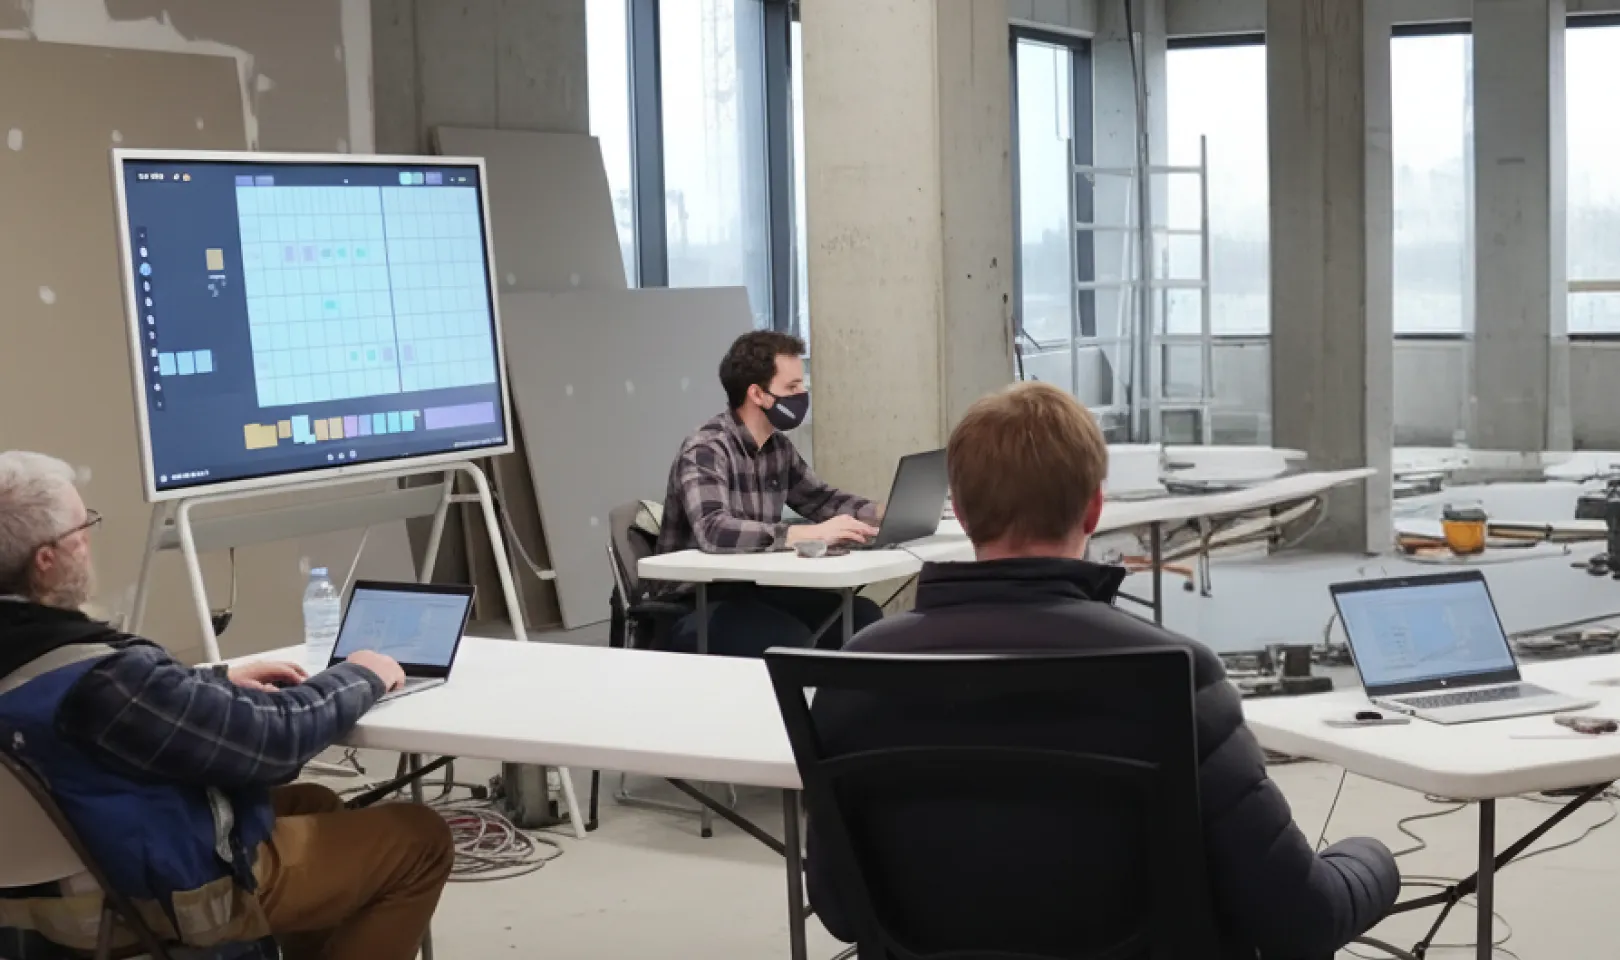
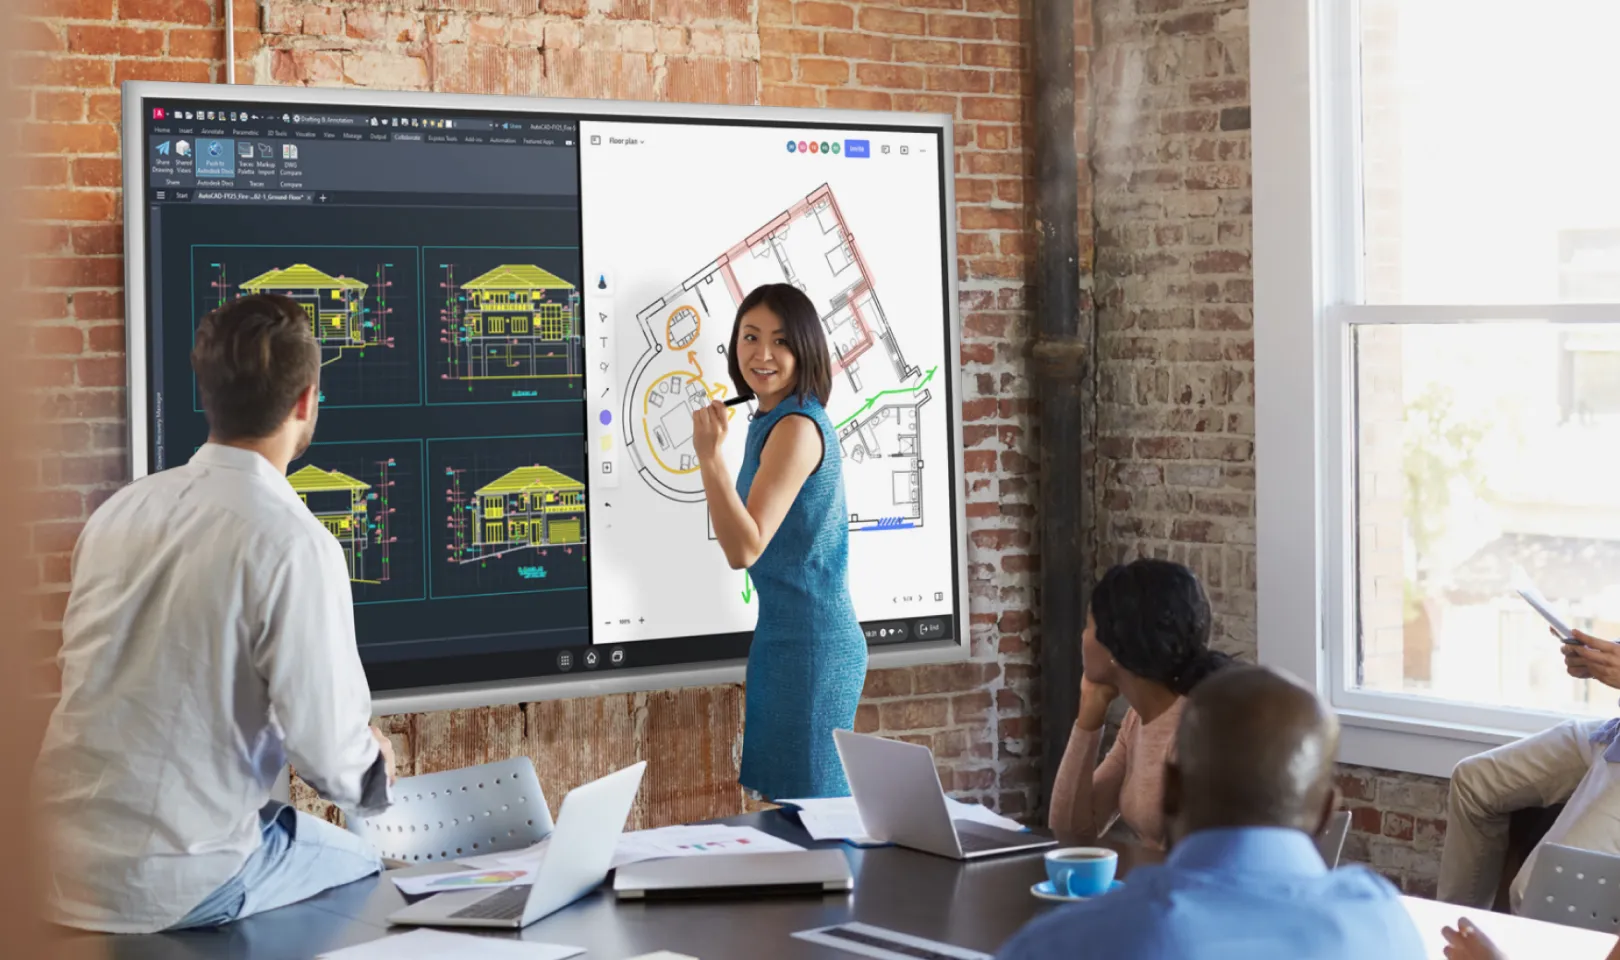
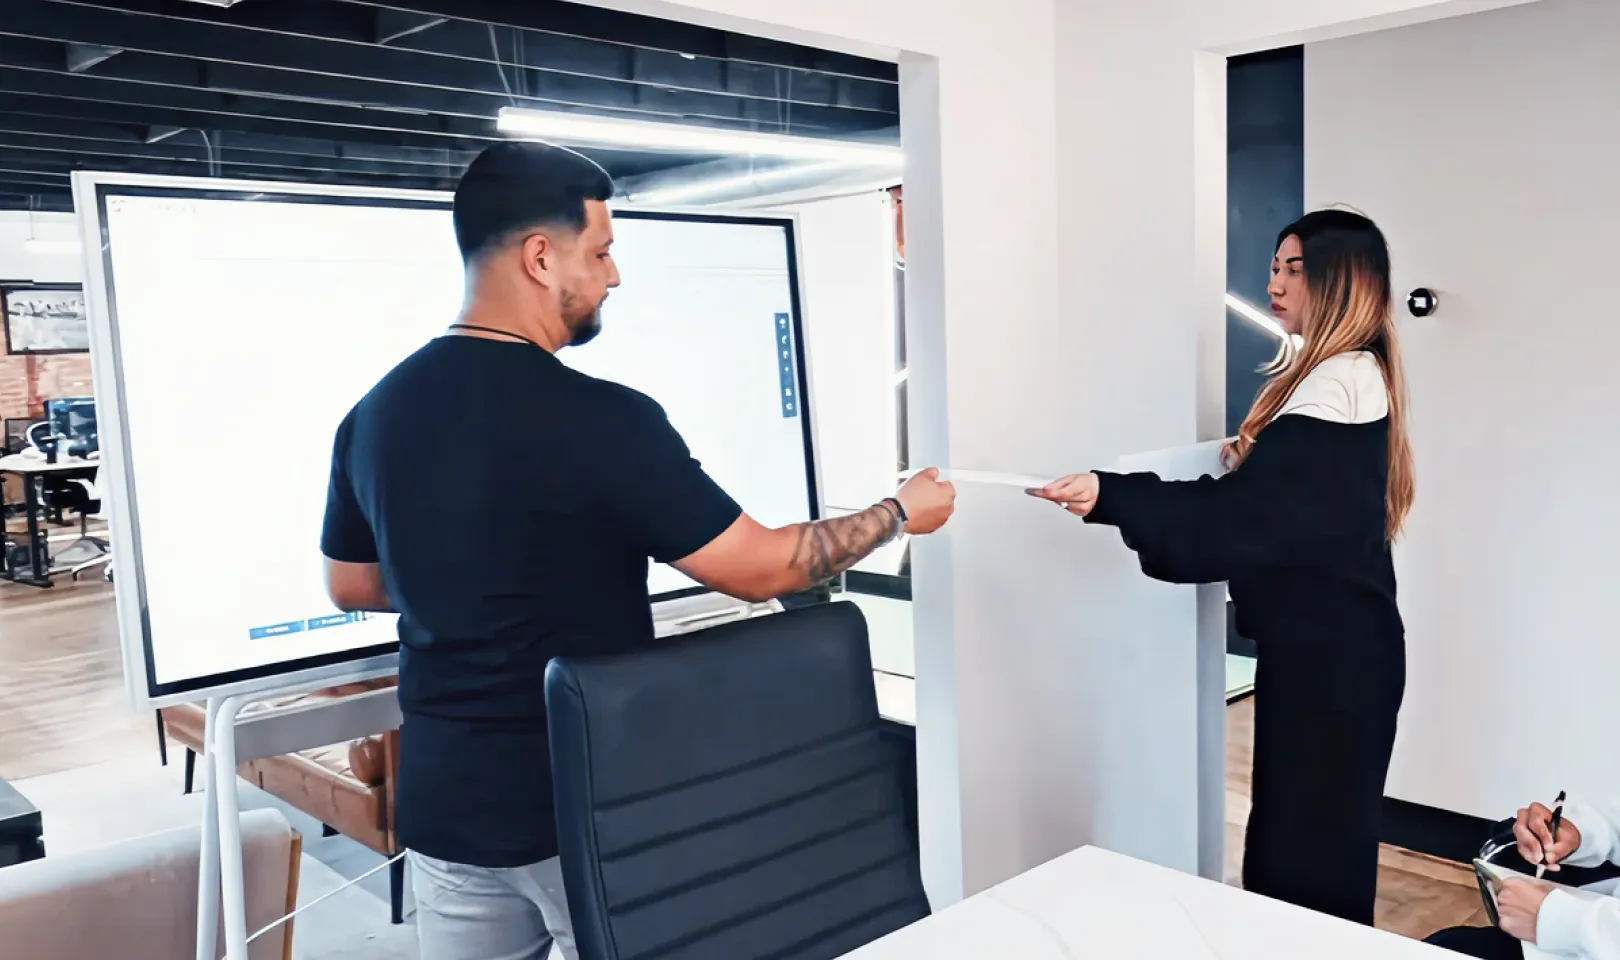
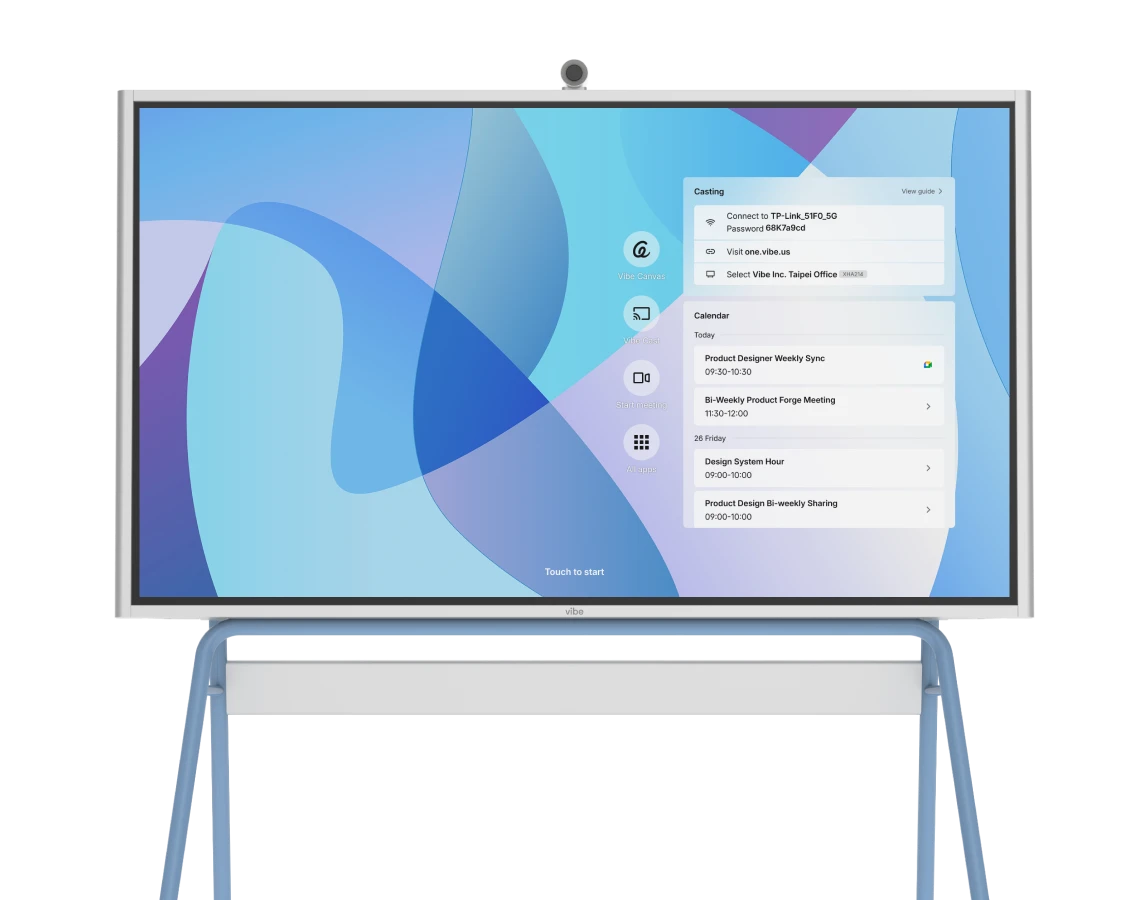
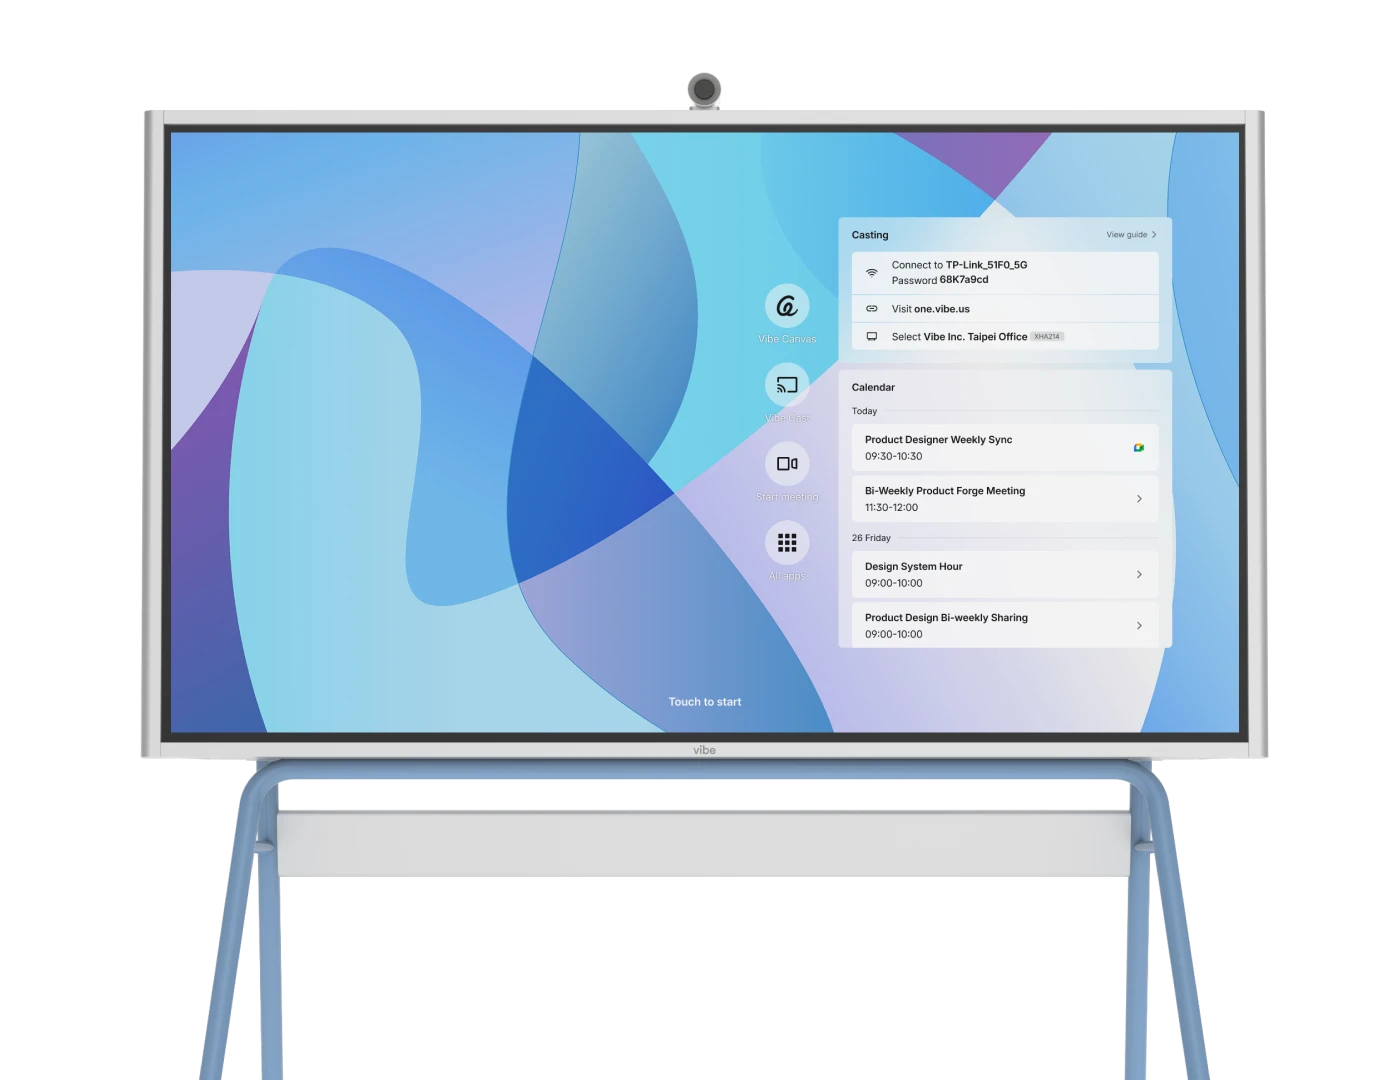
He was looking for a large-format collaboration board: something his teams could use to run meetings, mark up drawings, and present to clients. He’d been looking for an alternative to the Microsoft Surface Hub, which would have locked Sundt into a single ecosystem. Vibe offered the same large-format, touch-enabled experience at less than half the price, with the flexibility to run any application the team needed.
"I bought it on a Facebook ad," Dalton says. "And that was it, that's all it took: getting it in front of two people's hands. My VP of IT and our director of innovation saw it, and that was that."
A year and a half and 25 boards later, Sundt leverages Vibe Boards in nearly every phase of its projects, from the first client interview to the final safety walk.