
Picture the usual Monday review. Someone shares a screen, a KPI dashboard appears, the team nods at a few numbers, and the call ends. A week later, the same chart shows the same problem — because nobody decided anything. The dashboard worked perfectly. The review failed.
That gap matters more than ever. In a 2025 Salesforce survey of business decision-makers, 76% said they feel increasingly pressured to back their decisions with data — yet many still leave metrics meetings without a clear next step. And speed is part of the advantage: MIT research finds that companies able to turn data into quick decisions in real time dramatically outperform their competitors. A dashboard is only as valuable as the decisions it triggers.
This guide is about that last mile: not how to build a KPI dashboard (plenty of tools do that), but how to review one with your team so insights become owned actions. We’ll cover a quick primer for anyone new to dashboards, why most reviews stall, and a practical playbook for running reviews that end in decisions.
A quick primer: what a KPI dashboard is (and the main types)
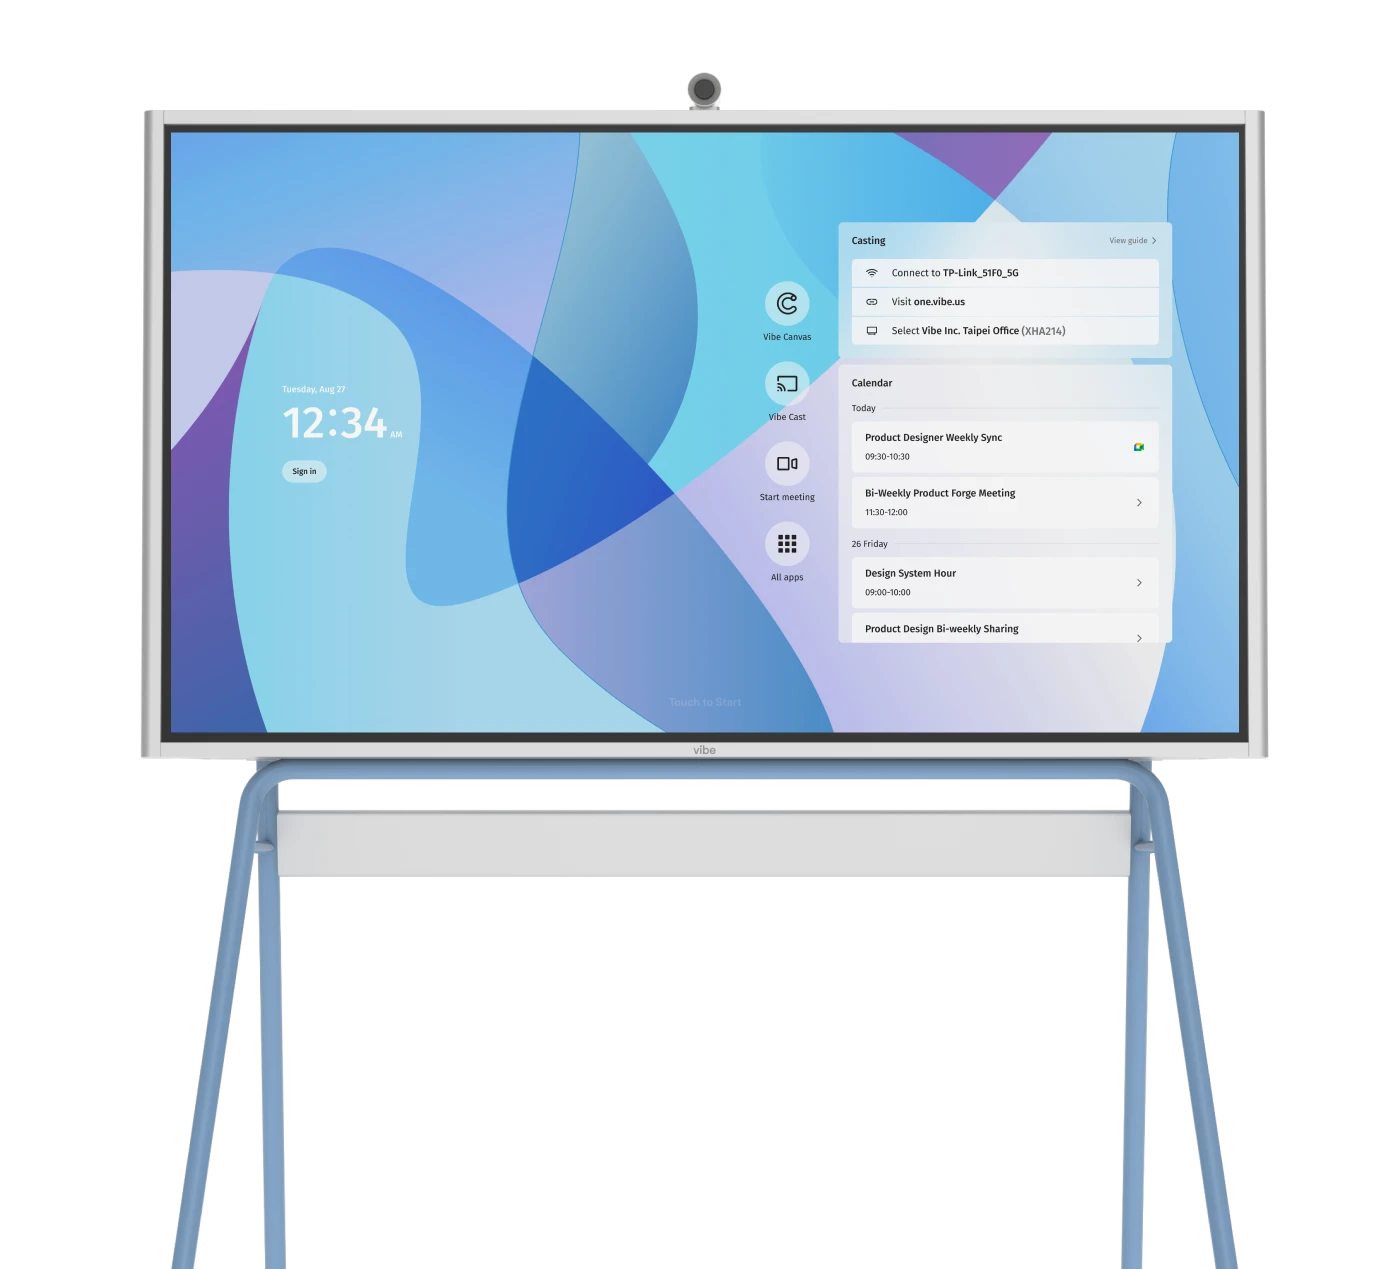
A KPI dashboard is a visual tool that pulls key performance indicators from several data sources into one place — charts, graphs, and trend lines that show, at a glance, how you’re tracking against goals. Think of it as a control panel for the business: just as a car dashboard shows speed and fuel together, a KPI dashboard shows your most important metrics together so you can read the situation quickly.
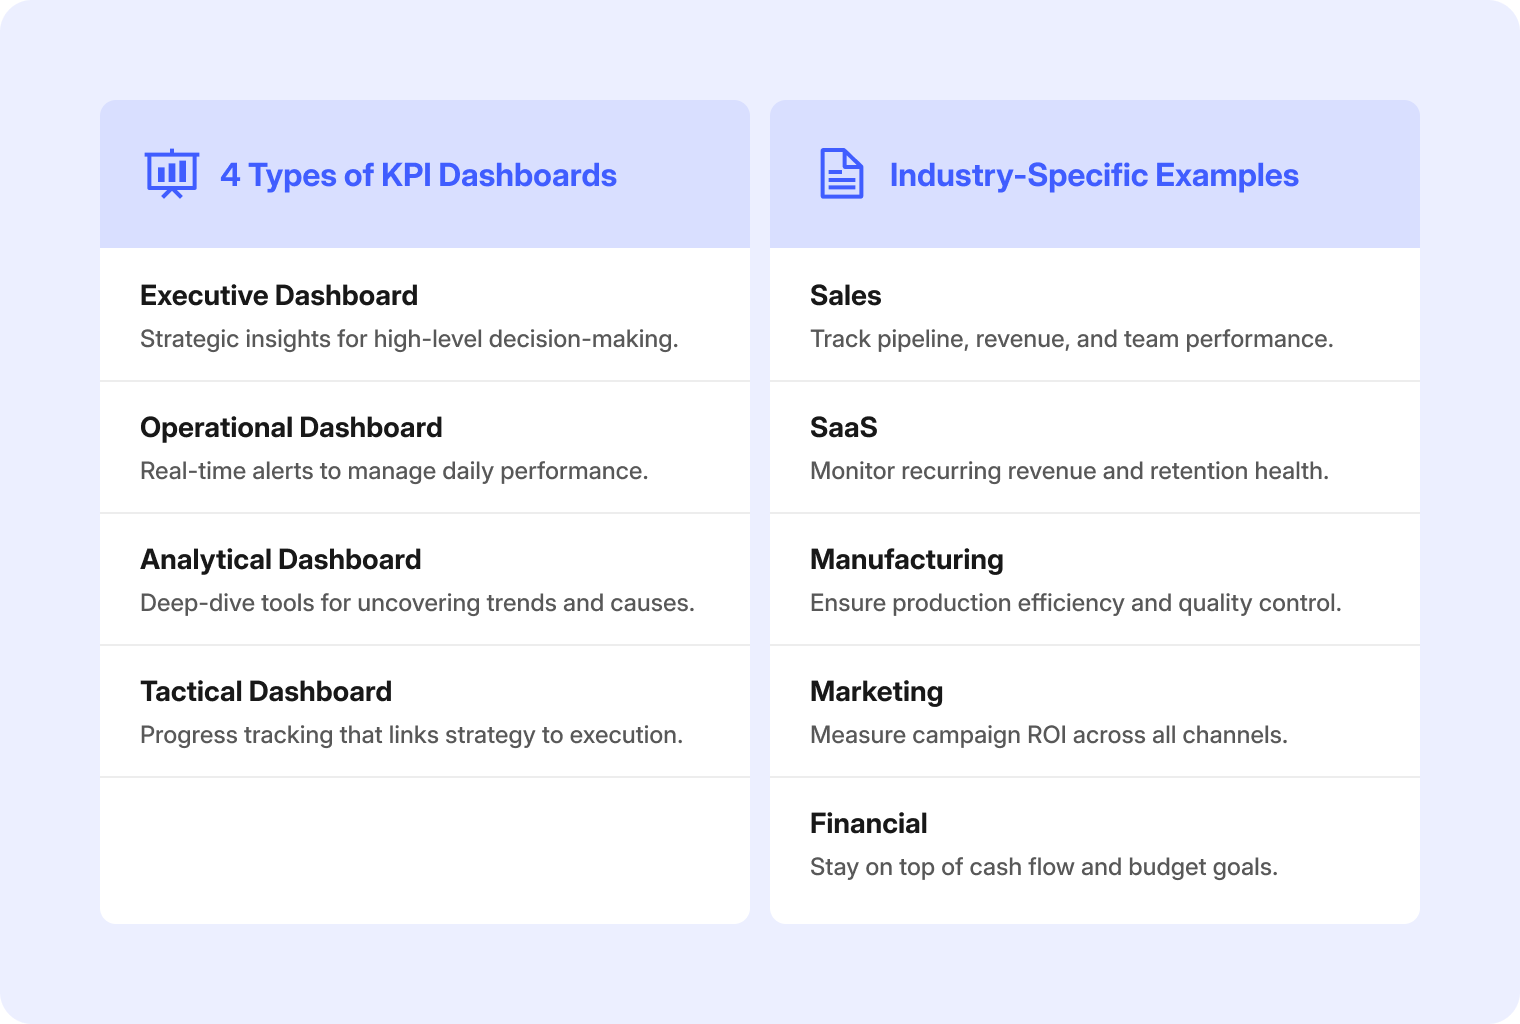
Most dashboards fall into four types, and which one you review depends on who’s in the room:
-
Executive — high-level strategy: revenue trajectory, margin, market position. Built for leaders steering direction.
-
Operational — real-time performance: an early-warning system for managers who need to catch and fix issues fast.
-
Analytical — deep dives: filtering, benchmarking, and historical comparison for the "why" behind a trend.
-
Tactical — medium-term goals and team progress, bridging strategy and day-to-day execution.
Matching the dashboard to the audience is the first quiet decision that makes a review work — an operational dashboard in an executive meeting buries the signal in detail, and vice versa.
Why most dashboard reviews stall
If your reviews feel busy but rarely change anything, it’s usually one of these:
-
The dashboard is presented, not interrogated. A static screen-share invites watching, not thinking. Nobody drills into the number that actually matters.
-
Remote teammates are second-class participants. In hybrid meetings, people dialing in often can’t see detail clearly or contribute to the same view, so half the room disengages.
-
Insights never become owned actions. A concern gets raised, everyone agrees it’s a concern, and the meeting moves on without an owner, a date, or a decision.
-
Nothing is captured. The annotations, the "let’s watch this metric," the agreed next step — none of it persists, so the next review starts from zero.
Fixing these is less about better charts and more about how the team interacts with the dashboard in the room.
A playbook for reviews that end in decisions
1. Choose the right dashboard for the audience
Before the meeting, decide what decision the review should produce, then bring the dashboard built for that altitude. Executives need the strategic view; an operations stand-up needs the live operational one. One screen, the right metrics, a clear purpose.
2. Make the dashboard interactive, not a slide
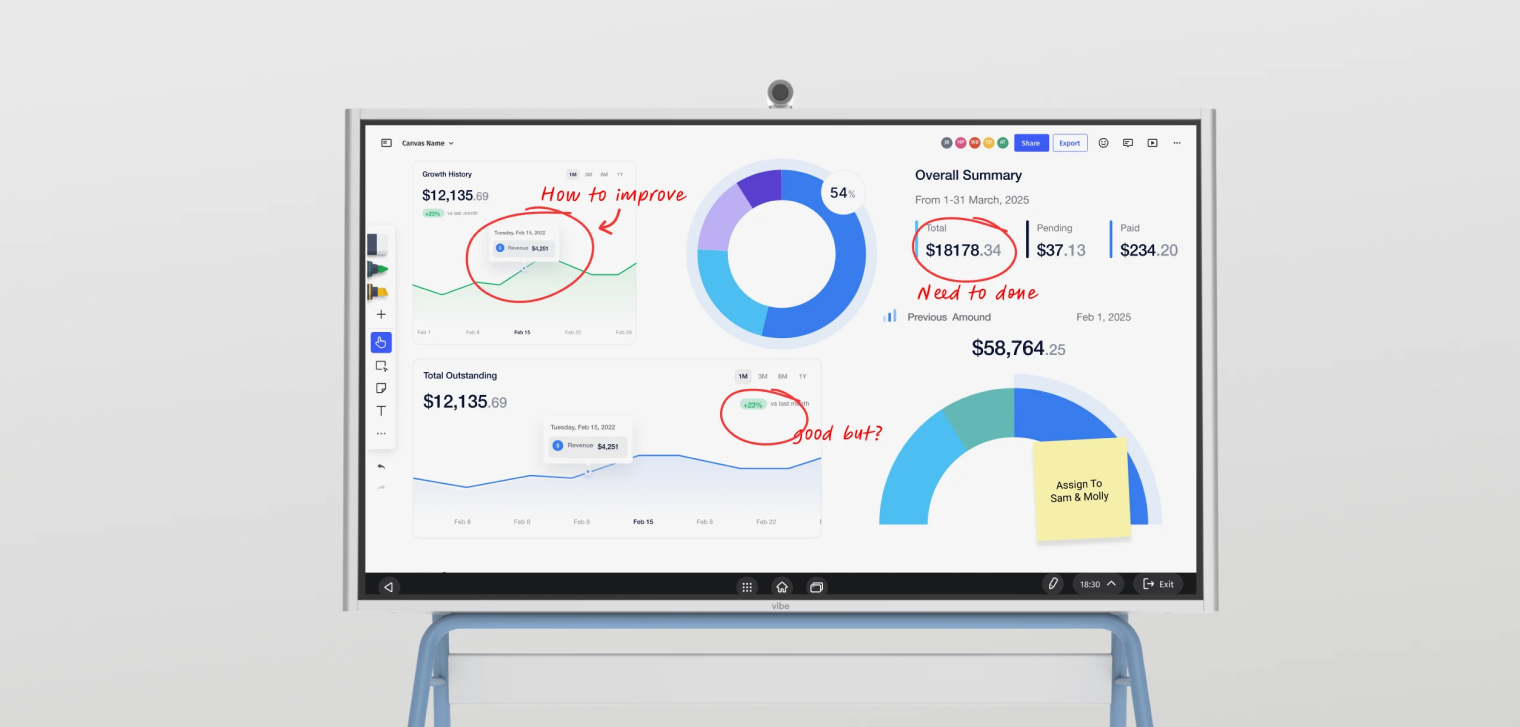
The single biggest upgrade is turning a passive readout into something the group can touch. Instead of one person narrating a screenshot, drill into the metric that’s off, filter to the segment in question, and annotate the chart live so the discussion happens on the data. When a team can mark up a trend together, the conversation shifts from "here are the numbers" to "here’s what we do about them."
This is exactly where an interactive display earns its place. Because the Vibe Board S1 runs ChromeOS, you can open the dashboards you already use — whether they live in Tableau, Power BI, Looker Studio, or a browser tab — directly on its 55″ or 75″ touchscreen, then write straight onto the chart with up to 20 points of multi-touch. A quarterly revenue miss stops being a slide and becomes something the team circles, questions, and solves in the moment.
3. Bring everyone into the same view
A review only drives decisions if the whole team is actually in it. For hybrid teams, that means remote members need to both see the detail and contribute. Paired with the optional Smart Camera, the Vibe Board S1 lets remote teammates join the same review through Zoom, Microsoft Teams, or Google Meet, while Vibe’s cloud whiteboard, Canvas, lets anyone add to the same canvas from a laptop, tablet, or phone. The goal is one shared surface, not a presenter and an audience.
4. Turn each insight into an owned action before you move on
Build a simple rule into the review: no metric gets discussed without ending in a decision — watch, act, or drop. If you act, name an owner and a date on the spot. Capturing those commitments next to the chart that prompted them keeps the "why" attached to the "what."
5. Capture the decisions so the next review starts ahead
The work of a review shouldn’t evaporate when the call ends. Annotated charts, agreed actions, and open questions should be saved where the team can pick them up next time. With Canvas, everything marked up during the session saves to the cloud automatically, so the next review opens with last time’s decisions already in view — and accountability built in.
What to review, by team
The same playbook adapts to whatever your team owns. A few common review sets:
-
Sales — pipeline health, conversion rates, average deal size, client engagement, and rep performance, to forecast and coach.
-
Marketing — leads, cost per acquisition, conversion by channel, and MQLs, to shift budget toward what’s working.
-
Finance — margins, cash flow, budget variance, and ROI, to keep spending aligned with targets.
-
Operations — output, defect rates, downtime, and inventory turnover, to catch issues before they escalate.
-
SaaS — MRR, churn, customer lifetime value, and activation, to protect and grow recurring revenue.
Whatever the metrics, the difference between a report and a result is the same: a review that ends in a decision and is captured for next time. That’s how high-performance teams keep communication and action aligned.
Ready to make your next metrics meeting a working session instead of a readout? See how the Vibe Board S1 supports collaborative reviews, or request a demo.

SaaS KPI Dashboard
SaaS companies require specialized dashboards to monitor subscription-specific metrics that differ significantly from traditional business models. These dashboards focus on metrics that directly impact long-term business viability and customer retention in the subscription economy.
Key Metrics to Track:
-
Monthly Recurring Revenue (MRR)
-
Customer churn rates
-
Customer Lifetime Value (CLV)
-
User activation rates
-
Net Promoter Score (NPS)
-
Feature adoption rates
These dashboards help SaaS leaders understand customer behavior patterns, identify expansion opportunities, and make data-driven decisions about product development and customer success initiatives.
Manufacturing KPI Dashboard
Manufacturing operations depend on real-time monitoring of production efficiency, quality control, and resource utilization to maintain competitive advantage. These dashboards provide plant managers with the visibility needed to optimize processes and minimize operational waste.

Key Metrics to Track:
-
Overall Equipment Effectiveness (OEE)
-
Production output rates
-
Defect rates
-
Machine downtime
-
Inventory turnover
-
Safety incident rates
Manufacturing dashboards enable proactive maintenance scheduling, production optimization, and consistent quality standards across all manufacturing operations.
Marketing KPI Dashboard
Marketing teams utilize specialized dashboards to measure campaign effectiveness across multiple channels and optimize resource allocation for maximum ROI. These platforms consolidate data from various marketing tools to provide comprehensive performance visibility.
Key Metrics to Track:
-
Lead generation numbers
-
Conversion rates by channel
-
Cost per acquisition (CPA)
-
Website traffic and engagement
-
Social media performance
-
Marketing qualified leads (MQLs)
Marketing professionals rely on these insights to identify high-performing channels, adjust campaign strategies, and demonstrate clear attribution between marketing activities and revenue outcomes.
Financial KPI Dashboard
Financial dashboards provide comprehensive oversight of organizational fiscal health through critical financial metrics and performance indicators. These tools support CFOs and finance teams in monitoring spending patterns and ensuring compliance with financial targets.
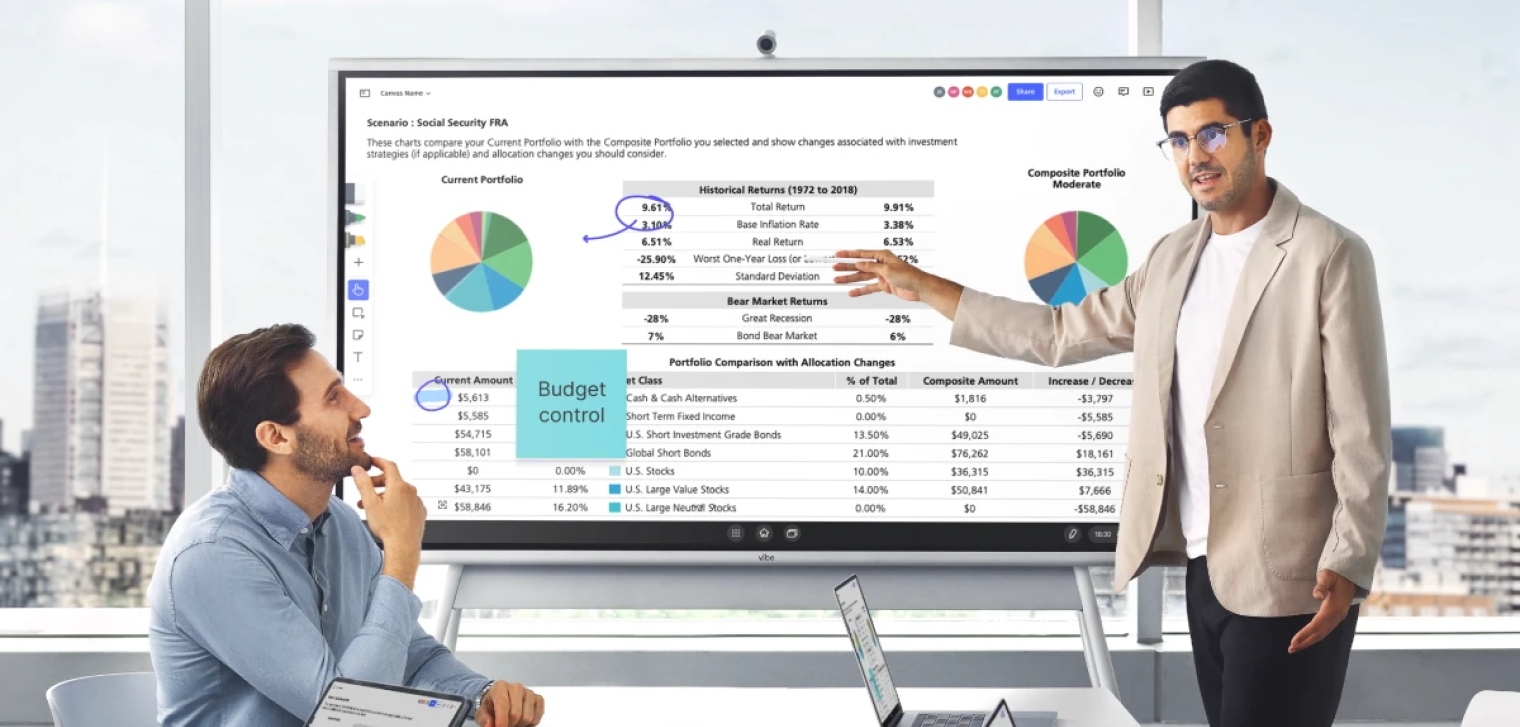 Man using a Vibe Board for portfolio comparison and budget control during a financial team meeting.
Key Metrics to Track:
-
Profit margins by product/service
-
Cash flow projections
-
Operational expenses
-
Budget variance analysis
-
Accounts receivable aging
-
Return on investment (ROI)
Financial dashboards support strategic planning through historical trend analysis and forecasting capabilities that inform investment decisions and resource allocation strategies.
8 Steps to Creating a KPI Dashboard
Building your first KPI dashboard doesn’t have to be overwhelming when you follow a structured approach. These actionable steps will guide you through the entire process, from initial planning to successful deployment.
Step 1: Define Your Business Goals and KPIs
Start by identifying the specific business objectives your dashboard needs to support, then select 5-10 KPIs that directly measure progress toward those goals. This foundation step is crucial because dashboards without clear purpose quickly become cluttered and ineffective. Involve key stakeholders in this process to ensure the selected metrics truly reflect what matters most to decision-makers and align with your organization’s strategic priorities.
Step 2: Map Out Your Data Sources
Map out all the systems, databases, and tools that contain the data needed for your selected KPIs, ensuring you have reliable access to accurate, up-to-date information. This step prevents future frustration by confirming data availability and quality before you begin building visualizations. Document any data integration challenges early so you can address them proactively rather than discovering limitations after investing time in dashboard design.
Step 3: Choose the Right Dashboard Platform
Select a dashboard tool that integrates seamlessly with your existing data sources while offering the visualization capabilities and user experience your team needs. Consider factors like ease of use, scalability, mobile accessibility, and total cost of ownership when evaluating options. The right platform should empower your team to create and modify dashboards without requiring extensive technical expertise or ongoing IT support.
Step 4: Plan Your Layout Before You Build
Create a logical, intuitive layout that prioritizes your most important KPIs and follows natural eye-scanning patterns for maximum usability. Position critical metrics in the top-left area where users naturally look first, and group related information together to tell a coherent data story. Sketch your layout before building to ensure the design supports quick decision-making rather than forcing users to hunt for key information.

Step 5: Connect, Integrate, and Automate Your Data
Establish automated connections between your data sources and dashboard platform to ensure metrics update regularly without manual intervention. Set up appropriate refresh schedules based on how frequently your data changes and how current your team needs the information to be. Test all data connections thoroughly to verify accuracy and establish monitoring processes to catch any integration issues quickly.
Step 6: Customize Visualizations and Metrics
Tailor your charts, graphs, and visual elements to your audience’s preferences while ensuring each visualization clearly communicates its intended message. Choose chart types that best represent your data—line graphs for trends, bar charts for comparisons, and gauges for progress tracking. Apply consistent color schemes and formatting throughout the dashboard to create a professional, cohesive appearance that enhances rather than distracts from the data.
Step 7: Test, Review, and Refine
Conduct thorough testing with actual users to identify usability issues, verify data accuracy, and gather feedback on the dashboard’s effectiveness. This validation step often reveals gaps between intended design and real-world usage patterns that need addressing. Schedule regular review sessions to ensure the dashboard continues meeting user needs as business requirements evolve and new data sources become available.
Step 8: Roll It Out and Regularly Maintain
Deploy your dashboard to key stakeholders and establish processes for ongoing maintenance, user training, and performance monitoring. Track how frequently different sections are viewed to understand which metrics provide the most value and which might need adjustment. Create user guides and provide training sessions to ensure team members can fully leverage the dashboard’s capabilities for improved decision-making.
KPI Dashboard Design Principles
Successful KPI dashboard design requires adherence to proven principles that prioritize user experience and data clarity over flashy visuals. These fundamental guidelines ensure your dashboard delivers actionable insights rather than becoming another source of information overload.
Make Interactions Obvious
Design your dashboard with clear visual cues that indicate which elements are interactive, clickable, or provide additional functionality when engaged. This principle reduces cognitive load and prevents user frustration by making the dashboard’s capabilities transparent and intuitive.
Choose Color for Clarity—Not Just Style
Select color schemes with high contrast that remain legible for users with color vision deficiencies, and pair colors with symbols, patterns, or text labels for universal understanding. Well-chosen colors enhance comprehension while poor color choices can make even the most accurate data difficult to interpret and act upon.
Establish a Clear Data Hierarchy
Organize dashboard content so the most important KPIs appear first and receive the greatest visual emphasis through size, position, and styling choices. This hierarchy ensures busy executives can quickly grasp key insights even during brief dashboard reviews while still providing access to detailed information when needed.
Keep Visuals Clean and Focused
Display only the most relevant KPIs and supporting visuals to prevent cognitive overload and maintain focus on actionable insights. Clean, uncluttered designs enable faster comprehension and decision-making by eliminating distractions and highlighting what truly matters.
Design for Real-Time and Device Compatibility
Design dashboards that automatically update with current data and display consistently across different devices and screen sizes. Responsive, always-current dashboards support agile decision-making and keep high-performing teams aligned regardless of their location or preferred device.

FAQ
What does KPI mean?
KPI stands for Key Performance Indicator — a quantifiable measure of how well a team or company is hitting a specific objective. A KPI dashboard brings several of these together in one view.
How do you present a KPI dashboard in a meeting?
Pick the dashboard built for your audience, then make it interactive rather than a static slide: drill into the metric that matters, annotate it live, and make sure remote teammates can see and contribute. End each item with a decision and an owner, and save the annotated view so the next review starts where this one left off.
How often should you review KPIs?
It depends on the dashboard’s altitude — operational metrics may warrant daily or weekly reviews, while executive and strategic dashboards are typically reviewed monthly or quarterly. The cadence should match how fast the underlying numbers change and how quickly the team needs to respond.
Which tools are used to build KPI dashboards?
Common dashboard-building platforms include Tableau, Microsoft Power BI, Looker Studio, Databox, Geckoboard, and Klipfolio, plus spreadsheet-based options like Excel or Google Sheets for simpler needs. These build the dashboard; an interactive display like the Vibe Board S1 is where teams review and act on it together.