
All businesses, no matter the industry, have to face some unexpected challenges to get a project from start to finish. Whether it’s product design, brainstorming, or just general problem-solving, identifying the cause of the issue at hand is essential to avoid future occurrences. However, it’s not always easy to pin down the particular source of the issue. In such a case, having a systematic approach might be quite helpful. That’s where the fishbone diagram comes in.
What Is a Fishbone Diagram?
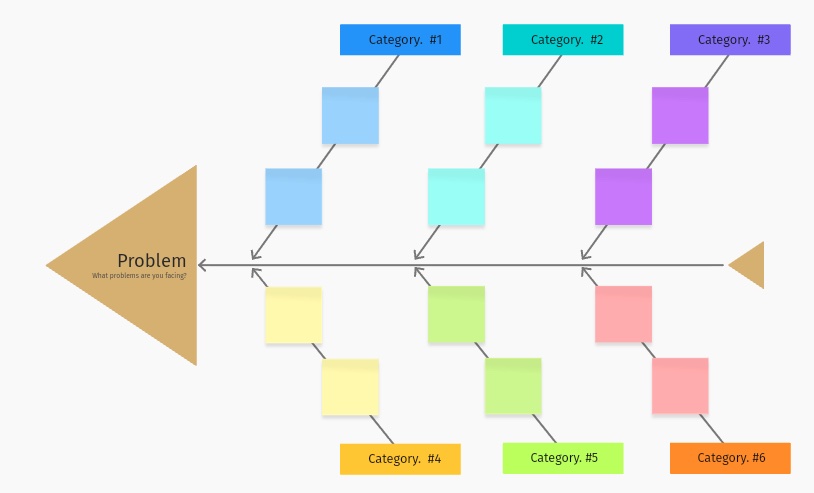 Fishbone diagram template – Vibe Board
A fishbone diagram — also called an Ishikawa diagram or cause-and-effect diagram — is a visual problem-solving tool that maps the potential root causes of a specific problem in a structured, branching layout. The problem or effect is placed at the "head" of the fish on the right side of the diagram, and the major categories of potential causes branch off a central spine like the bones of a fish skeleton, with more specific sub-causes extending from each branch.
It was developed by quality management pioneer Kaoru Ishikawa in the 1960s for use in manufacturing, but teams across industries now use it for any situation where a problem has multiple potential causes and the goal is to find the root, not just treat symptoms.
There are two modes of use: reactive (investigating a problem that has already occurred) and proactive (identifying risks before a process begins). Both use the same structure.
How to Use the Fishbone Diagram
 Use cases of fishbone diagrams
Fishbone diagrams are useful for practically every business, as well as any individual or group that is trying to solve an issue or build product roadmaps.
Fishbone diagrams were first designed as a tool for quality control, but you can find them useful in the following situations as well:
-
Enhancing community problem-solving efforts and maintaining focus.
-
Analyzing a complex issue with numerous potential causes;
-
Looking at a topic from a fresh perspective.
-
Determining what the likely underlying reasons are for an outcome or an issue.
-
Discovering where a process is failing and why, as well as locating any bottlenecks that may be present.
-
Speeding up the thought process in situations when more traditional methods of problem-solving would take too much time.
-
Tackling difficult problems in creative new ways and coming up with innovative solutions.
Benefits of Fishbone Diagrams
 Benefits of fishbone diagrams
A fishbone diagram is a fantastic tool for getting to the core cause of a problem and treating it in a meaningful way.
Here are some of the key benefits of using a fishbone diagram to problem-solve:
Effective Visualization
A fishbone diagram is a useful visualization tool that may assist you in determining the causes of the problems. Sometimes, breaking down a problem with easy-to-understand visuals can be the breakthrough you needed all along. Even better, now all the steps required to fix the problem are laid out in front of you in the diagram.
Make the Team Focus
A fishbone diagram helps your team maintain focus while addressing both the challenges at hand and the essential procedures to address them. Problem-solving can be a fantastic way to get the team together, and it ensures that these issues won’t pop up in the future, removing potential stressors from the team.
Chance for Advancement
Since all of the processes are shown in one straightforward diagram, looking for specific process improvements is easy. A fishbone diagram can help you visualize and understand dynamics you may have otherwise overlooked when problem-solving using another method.
Collaborative Brainstorming Process
One of the most significant advantages of using this diagram is that it allows the team to brainstorm together. As we mentioned before, nothing gets the team together like a good brainstorming session. It’s a great team-building exercise and makes sure that everyone in the team is heard and can contribute to the process.
Discover the Problems Quickly and Easily
Additionally, the tool makes it much simpler for you to recognize problems, which is a vital step for doing an in-depth analysis. As a result, the fishbone diagram is highly beneficial for recognizing the problems that the stakeholders face and the required solutions to those problems.
Increases Individual and Team Understanding
The use of a fishbone diagram helps to guarantee that all members of the team are on the same page. This tool is a must-have for the company or team if they are having trouble assessing the problem or maintaining the speed of the work.
Fishbone Diagram Examples

Example 1
For the first example of a fishbone diagram, let’s say a wrong, late, or damaged delivery is the issue at hand. The list of potential causes is long and might include incorrect address labels, damaged goods due to poor packing, and shipping mistakes. In order to categorize the primary reasons, we may use a fishbone diagram to display the data.
The problem could be bad weather, traffic, vehicle problems, or even with the staff of the company—determining which cause is at play will help address the issue.
Example 2
Another use for a fishbone example is solving issues in food service. Advisors from a fast food joint can figure out what has the potential to go wrong while prepping an order to ensure customer service, employee satisfaction, and efficiency are all at their best. Fishbone diagrams can help them identify what’s at play in disrupting meal prep: Is it the storage and cooking equipment, or hygiene? Or is it the incorrect amount of spices, or a flawed recipe? Determining all of this will help find any underlying causes to meal prep mishaps.
How to Make a Fishbone Diagram
So, what are the specifics on how to create a fishbone diagram? First, identify everyone who’s engaged with or impacted by the problems that you’re trying to solve. This way, you’ll be able to bring a group with you.

-
Identify a problem statement: The members of the relevant team, as well as the stakeholders, should come up with a statement that characterizes the issue, and they should all agree on it. This is determined by a horizontal arrow pointing in the direction of the diagram head.
-
Brainstorming the primary reasons: In order to make the brainstorming session more efficient, the underlying causes of the issue are organized into groups such as personnel, methodology, equipment, material, medium, and metric. The categories are represented graphically as fish bones, with arrows leading to the fish’s spinal column in the diagram.
-
Analyze other causes: The assessment team should uncover contributing reasons to each main cause group using methods of root cause analysis. To do this, the analysis team should first brainstorm all potential causes. On the diagram, they’re shown in the form of branches that extend from the fish’s bones. The layered bones that are formed as a result of recognizing sub-causes demonstrate the causal linkages between the different factors.
-
Examine the diagram: The team analyzes all of the primary reasons, as well as the factors that contributed to the problem, by asking ‘why’ questions. If the underlying cause of the issue being discussed is not identified, the brainstorming process will continue while the attention is shifted to regions of the diagram that aren’t yet filled out with ideas.
Tools for Creating Fishbone Diagrams
You can create fishbone diagrams using a wide range of tools. Some examples of these tools are Microsoft Excel, Microsoft Word, Microsoft PowerPoint, and more complex graphic design applications, including Figma, Edraw Max, Canva, and Miro. However, you can get started with a simple whiteboard and some Post-its to organize your categories of issues.
Vibe Board and Vibe Canvas

Running a fishbone session on a physical whiteboard works — but when teams are hybrid, distributed, or need to revisit their diagram after the meeting, a digital canvas makes the process significantly more practical.
The Vibe Board S1 is a 55″ or 75″ interactive whiteboard that lets a whole team gather around a shared surface and build a fishbone diagram together in real time. The large format means everyone can see and contribute simultaneously, which is essential for root cause sessions where input from multiple roles matters. No pen caps, no erasing, no one person controlling the marker.
Paired with Vibe Canvas — Vibe’s infinite online whiteboard — you get a pre-built Fishbone Diagram Template that eliminates setup time and lets the team focus on the actual analysis. Canvas automatically saves everything to the cloud, so you can export, share, and pick up where you left off from any device. Team members who weren’t in the room can view the diagram and add their input asynchronously.

FAQs
What is a fishbone diagram?
A fishbone diagram (also called an Ishikawa or cause-and-effect diagram) is a structured visual tool that maps the potential root causes of a problem. The problem is placed at the "head" of the diagram, and possible causes are grouped into categories along branches extending from a central spine — resembling a fish skeleton. It helps teams move beyond surface symptoms to identify the underlying reasons a problem occurred.
What is a fishbone diagram used for?
Fishbone diagrams are used to identify and analyze the root causes of problems in any process, product, or service. Common applications include quality control in manufacturing, process improvement in operations, customer service failures, project delays, and healthcare incident analysis. The tool is equally useful for proactive risk identification — mapping what could go wrong before a process begins — and for reactive investigation after a problem has occurred.
How do you make a fishbone diagram?
Start by writing the problem statement at the right end of a horizontal arrow (the fish’s head). Draw the main spine left from the head. Add diagonal "bone" branches for each major category of potential causes — commonly People, Process, Equipment, Materials, Environment, and Measurement. Brainstorm specific causes under each category and add them as smaller sub-branches. Once the diagram is complete, the team reviews all branches to identify which causes are most likely responsible for the problem and prioritize them for further investigation.
How do you fill out a fishbone diagram?
Fill out a fishbone diagram by working through each cause category with your team. For each main branch (e.g., People, Process, Equipment), ask "what could cause this problem in this area?" and add each answer as a sub-branch. Keep asking "why?" to break causes into more specific sub-causes where possible. The goal is not to list every possible factor, but to surface the causes most likely to explain the problem — so focus discussion on root causes rather than symptoms.
How do you complete a fishbone diagram?
A fishbone diagram is complete when all major cause categories have been explored and the team has identified the most probable root causes. After filling in the branches, review the full diagram together: look for causes that appear in multiple categories (a strong indicator of significance), causes that are supported by data or direct observation, and areas that still need investigation. Mark the highest-priority causes and use them to drive next steps — whether that’s further data collection, process changes, or corrective action.
Is there a fishbone diagram template?
Yes. Fishbone diagram templates are available in tools like Microsoft Word, PowerPoint, Miro, and Figma. Vibe Canvas also includes a pre-built Fishbone Diagram Template that you can open directly and edit with your team in real time — on a Vibe Board in the room or from any browser. The template handles the structure so your team can focus on the analysis.