

On average, employees waste 26% of their workday on avoidable administrative tasks and outdated processes. That’s more than a quarter of each day lost to inefficiency—time that could be spent on creative and strategic efforts. These hidden productivity drains often go unnoticed, but they can suck up time that would be better spent moving projects forward.
Visual workflow mapping changes that problem by turning complex processes and projects into diagrams your whole team can understand. Mapping out your processes shows you where bottlenecks occur, where team communication breaks down, and where automation can make the biggest impact. In this article, we’ll look at the important parts of visual workflows, some types of modeling you might use, and how to get started.
- Inefficiencies often hide in plain sight, wasting over a quarter of the average workday.
- Visual workflow mapping reveals bottlenecks and simplifies process optimization.
- Clear, shareable maps improve collaboration and accountability across teams.
- Automation opportunities become easier to identify through mapped workflows.
- Tools like Vibe turn process maps into dynamic, interactive collaboration spaces.
What Is Workflow Process Mapping?
Workflow process mapping is a visual technique used to outline every step in a process, from start to finish. It illustrates how tasks, decisions, roles, and information move through a system. All of that gives you essentially a blueprint of how work gets done. Having this map lets you see the big picture of your operations at a glance.
Having a workflow map can help improve clarity and alignment. When processes are visible, inefficiencies and redundancies become obvious—whether it’s unnecessary approvals, unclear ownership, or repeated manual work. Shared visibility also creates better onboarding and cross-functional collaboration, since everyone can literally see how their work fits into the bigger system.
An effective workflow map doesn’t just capture how things currently operate—it also shows what could be improved. There are "as-is" processes, which reflect the current reality, and "to-be" processes, which represent the optimized future state. Mapping both allows you to bridge the gap between where you are and where you want to be.

Why Workflow Process Mapping Matters
When every step of a process is visualized, it becomes much easier to identify where things slow down or break down. For example, a simple workflow map might reveal recurring delays in purchase order approvals or redundant review cycles that add unnecessary time. Having that information empowers you to reduce the bottleneck and improve productivity.
Mapping also increases standardization and accountability across teams. When everyone follows the same defined steps, errors decrease, handoffs are smoother. A well-documented map clearly defines each role and responsibility, so that nothing slips through the cracks. That also can help create a sense of ownership because your team members know exactly where they fit in and what they’re responsible for.
Process maps are also a great way for you to figure out where you should be automating processes—like manual data entry in HR or multiple inventory approvals. Automating these steps not only reduces human error but also frees up valuable hours for strategic, high-impact work.
Key Components of a Workflow Process Map
A workflow process map breaks complex operations into clear, visual elements that show how work moves through a system. Below are a few of the components you’ll want to make sure your process maps include:
-
Tasks and activities. These are the core action steps that make up a process. Each task represents a specific action—such as "submit form" or "review invoice"—and is typically depicted by a rectangular symbol.
-
Roles and responsibilities. Every task must have a clear owner. This element identifies who performs each step and when, ensuring accountability and clarity across departments. Swimlanes are often used to separate responsibilities visually.
-
Inputs and outputs. Inputs are the resources or information needed to begin a task, while outputs are what each step produces. Tracking these ensures continuity and helps identify where handoffs may fail.
-
Decision points. Often represented by diamond shapes, these mark moments where the process branches based on conditions or outcomes (e.g., "Approved?" → Yes/No). They’re critical for understanding workflow logic.
-
Flow/direction. Arrows and connectors indicate the order of operations, helping you trace the path from start to finish without confusion.
-
Triggers. These are the events or conditions that start or restart a workflow, such as a customer order, system alert, or scheduled deadline.
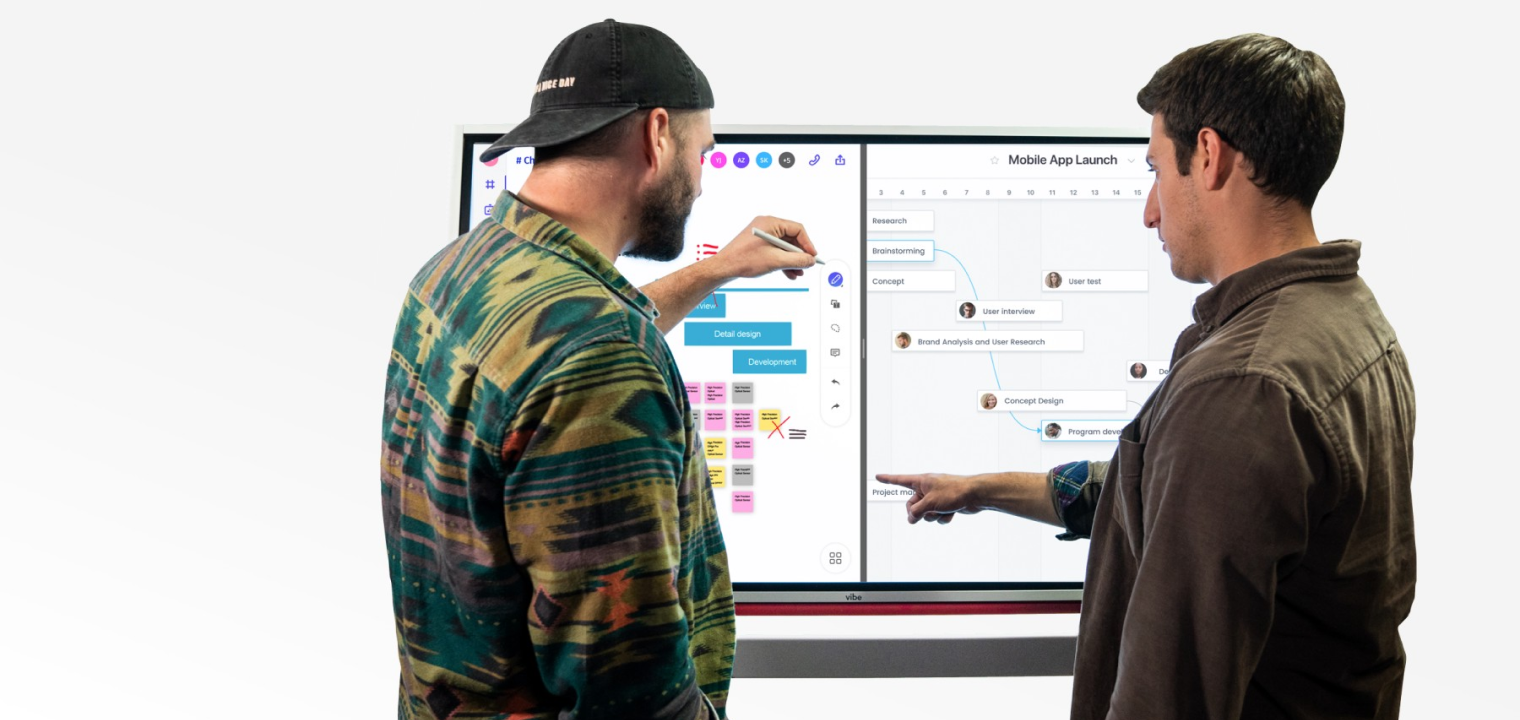
 Team using a Vibe Board to clarify the tasks and the roles in a workflow
Types of Workflow Process Maps
Workflow process maps come in several formats. The right type depends on whether you’re documenting a simple routine, analyzing value creation, or preparing for large-scale automation. Below are five of the most common and effective mapping styles used across industries.
Basic Flowchart
A basic flowchart is the most straightforward form of process mapping, which gives you a clear, linear view of how tasks progress from start to finish. It uses simple shapes—rectangles for activities, diamonds for decisions, and arrows for direction—to show the sequence of actions. For example, you could use it to track a customer support ticket from submission to resolution, highlighting each step such as "receive ticket," "assign to agent," and "close case."
Swimlane Diagram
A swimlane diagram organizes activities by department, team, or role, visually separating responsibilities across "lanes." This format clarifies ownership and highlights where work passes between functions. Using swimlanes can help you pinpoint where delays may be happening. You could use this diagram to map an employee onboarding process that spans HR, IT, and management—illustrating how each contributes to a smooth new-hire experience.
Value Stream Map (VSM)
A value stream map comes from Lean methodology and focuses on identifying which steps add value and which create waste. It combines process flow with performance metrics like lead time and cycle time to drive operational efficiency. For example, you could use a VSM to improve a warehouse order fulfillment system to eliminate bottlenecks and reduce waiting time between packing and shipping.
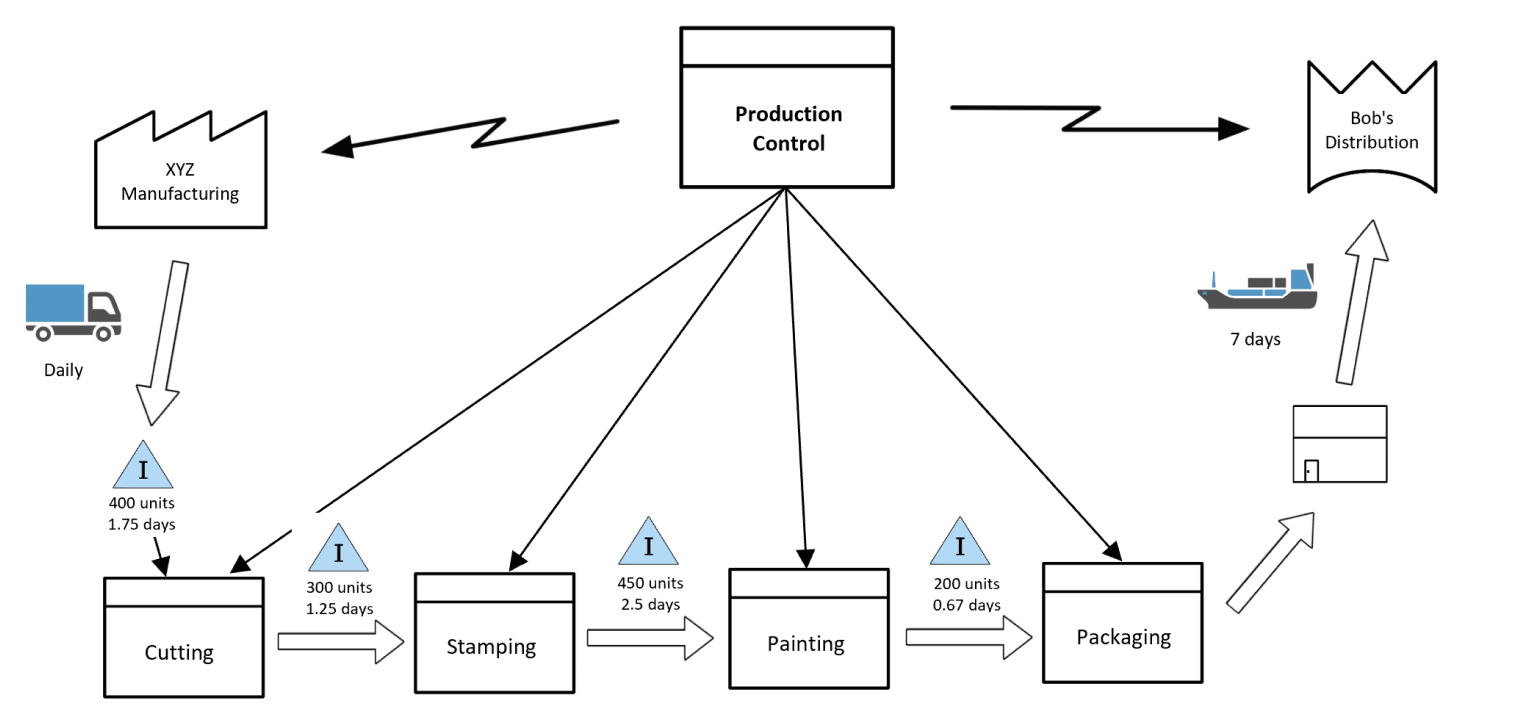 Complex industrial processes are turned into a simple value stream map.
SIPOC Diagram
The SIPOC (Suppliers, Inputs, Process, Outputs, Customers) diagram provides a top-down overview of a process before diving into details. It’s commonly used in Six Sigma and process improvement initiatives to align teams on scope and context. It can outline stakeholders and context to define what’s inside and outside process boundaries. You might use it for something like launching a quality improvement initiative in healthcare administration, clarifying the flow between patient intake, medical staff, and data systems.
BPMN
Business Process Model and Notation (BPMN) is the global standard for documenting and automating sophisticated workflows. It supports multiple paths, conditional logic, and system integrations—making it ideal for digital transformation initiatives. It’s widely used in enterprise systems and compatible with process automation software. BPMN is great for automating lead capture, email marketing, and CRM updates within a unified sales funnel.

Step-by-Step: How to Build a Workflow Process Map
These are the general steps to build a process map that’s accurate, actionable, and aligned with your organization’s goals.
1. Define the Process
Start by identifying what process you’re mapping and why. Think about its scope, objectives, and the outcomes you want to achieve. For instance, are you trying to reduce approval time, improve customer experience, or standardize team operations? Defining these parameters helps set expectations.
2. Gather Stakeholders
Involve the people who actually run or manage the process. They know the real workflows—the shortcuts, the pain points, and the exceptions. Including these voices early ensures the map reflects how work truly happens, not just how it’s supposed to happen on paper.
3. Set Boundaries
Every process has a beginning and an end. Mark where the process starts and where it finishes, such as "customer submits request" to "request approved and logged." Setting boundaries keeps the map concise and ensures the scope remains manageable.
4. Identify Tasks and Decisions
List out every action and decision involved in completing the process. Capture the real-world steps people follow, not idealized ones. Identify key decision points that change the process flow—like "Review contract" leading to "Approve," "Revise," or "Reject."

5. Choose a Format and Tool
Select a mapping format that fits your process complexity:
-
Use a flowchart for straightforward workflows.
-
Choose a swimlane diagram for multi-team handoffs.
-
Adopt BPMN for automated or system-integrated processes.
Pick a digital tool that supports collaboration, version control, and visual clarity—like Vibe Canvas, Lucidchart, or Microsoft Visio. Prioritize platforms that are intuitive and accessible to everyone on the team.
6. Draw the Initial Map
Start your draft using standard process symbols:
-
Rectangle = Task
-
Diamond = Decision
-
Arrow = Sequence or flow
Lay out the process logically (left-to-right or top-down) and label steps clearly using action verbs like "Submit," "Verify," or "Approve." Assign roles where relevant and keep the layout simple to make review and revisions easier.
7. Validate with Stakeholders
Share your draft with the team to ensure accuracy. Ask questions like:
-
"Is anything missing?"
-
"Is this how it actually works?"
Update the map based on feedback, so that all participants agree the visual accurately represents the process before finalizing.

8. Analyze for Bottlenecks and Waste
Review the completed map to spot inefficiencies. Look for delays, redundant approvals, unclear handoffs, or steps that don’t add value. Quantify these issues where possible (e.g., average wait time per step).
9. Update and Create "To-Be" Map
Once the current ("as-is") process is validated, design the optimized "to-be" version. Remove or automate repetitive steps, simplify decision paths, and realign roles to speed up execution. The improved version should clearly demonstrate how the new process supports business goals—whether that’s faster cycle times, lower costs, or higher quality outcomes.
Benefits of Workflow Process Mapping
When processes are visualized, inefficiencies become visible—and improvements become actionable. The following benefits highlight why mapping is one of the most effective tools for building smarter, more agile organizations.
-
Increased efficiency. By laying out each step visually, you can quickly identify redundant or unnecessary actions. Streamlining these workflows reduces wait times, minimizes rework, and accelerates delivery without sacrificing quality. The result is a leaner, more productive operation.
-
Improved communication. Process maps eliminate ambiguity by showing exactly who does what, when, and how. This shared visibility helps teams align on goals, understand dependencies, and collaborate more effectively—especially in cross-functional environments like marketing or sales.
-
Faster onboarding. A well-documented workflow serves as a visual training guide. New employees can grasp entire processes at a glance and avoid the trial-and-error phase that often slows early productivity.
-
Better compliance. Workflow maps double as compliance documentation. They make it easier to demonstrate how procedures follow internal policies or regulatory requirements—particularly useful during audits or process certifications.
-
Automation opportunities. Mapping reveals where repetitive manual steps—like data entry or routine approvals—consume valuable time. These insights make it easier to introduce automation tools.
-
Stronger decision-making. When decision-makers can visualize process performance, they can base improvements on evidence, not assumption. Data linked to workflow maps—such as cycle times or approval rates—supports more confident, measurable change.
-
Process standardization. Standardized workflows create consistency in how tasks are executed across teams and locations. With everyone following the same process, you achieve predictable results, stronger quality control, and an easier path to scale.

Tools & Software for Workflow Mapping
The right tool makes all the difference when turning complex workflows into clear, actionable visuals. Below is a quick overview of leading workflow mapping tools—each suited to different team sizes, budgets, and levels of complexity.
|
Tool |
Price Point |
Learning Curve |
Best Team Size |
Key Differentiator |
|
Premium Hardware + Software Bundle |
Low |
Mid to Large Teams |
Real-time whiteboarding with 4K touchscreen | |
|
Lucidchart |
Freemium to Business Plans |
Low |
Small to Mid Teams |
Fast, visual mapping with collaborative editing |
|
Microsoft Visio |
Enterprise License |
Moderate |
Large Enterprises |
BPMN support and Microsoft 365 integration |
|
Miro |
Freemium to Team/Business Plans |
Low |
Any Size |
Flexible canvas ideal for ideation + mapping |
|
Creately |
Freemium to Business Plans |
Low |
Small to Mid Teams |
Visual database + mapping combined |
|
ClickUp |
Freemium to Business Plans |
Moderate |
Small to Mid Teams |
Workflow mapping integrated with task management |
|
Asana |
Freemium to Premium Plans |
Low |
Small to Large Teams |
Simple mapping tied to projects and tasks |
Vibe Canvas
Vibe Canvas is where teams come together to bring ideas to life. Built with an intuitive interface that works beautifully on touchscreens and beyond, it gives your ideas room to grow—whether you're working side by side or connecting from different places. Draw freely on an endless canvas, turn handwriting into clean text, and work together across any device in real time. From quick brainstorms to project planning, Vibe Canvas makes visual collaboration easy and effective.
Lucidchart
Lucidchart is known for its intuitive drag-and-drop interface that makes process mapping fast and approachable for all skill levels. It supports real-time collaboration, automatic version control, and cloud synchronization across devices. Remote teams especially appreciate how easily they can build and share flowcharts, swimlanes, and BPMN-style diagrams with minimal setup.
Microsoft Visio
Microsoft Visio is the enterprise standard for creating professional, compliant process maps. It supports BPMN notation, integrates well with Microsoft 365, and allows teams to embed process data directly from Excel or Power Automate. Its formal structure makes it ideal for documenting complex enterprise workflows and audit-ready process documentation.
Miro
Miro offers a versatile online whiteboard for brainstorming, wireframes, customer journey maps, and workflow diagrams—all on one infinite canvas. Its template library and integrations with tools like Jira and Slack make it a favorite for Agile teams.
Creately
Creately combines visual diagrams, data tables, and team notes in one collaborative workspace. This hybrid approach lets teams connect visuals to structured data, making it ideal for smaller teams that want to move beyond static diagrams. It’s a lightweight but powerful option for structured ideation and process design.
ClickUp
ClickUp merges project management and workflow visualization in a single platform. Teams can diagram processes, then directly assign and track those steps as tasks—bridging the gap between planning and execution. This integration makes it an excellent choice for teams seeking real-time accountability and end-to-end visibility.
Asana
Asana offers an easy-to-use task management interface that doubles as a workflow mapping tool. Its boards and timelines visually mirror mapped processes, allowing you to see dependencies and progress at a glance. Asana’s scalability makes it ideal for organizations of any size.
Common Workflow Mapping Mistakes to Avoid
Even well-intentioned process maps can fail if they’re unclear or incomplete. Avoiding these common mistakes ensures your workflow diagrams stay practical.
Overcomplicating the Map
-
What to avoid: Including every minor step, exception, or conditional branch makes your map overly complex and difficult to follow. A cluttered diagram overwhelms users and obscures the insights you’re trying to gain.
-
How to avoid it: Focus only on the key activities and outcomes that drive the process forward. Save minor variations for separate sub-processes or detailed documentation.
Missing Stakeholder Involvement
-
What to avoid: Designing workflows without the input of those who actually execute or manage the tasks. This leads to inaccuracies and poor adoption.
-
How to avoid it: Involve stakeholders early—from front-line employees to process owners. Their firsthand experience ensures the workflow reflects reality and earns buy-in from all participants.
Skipping Validation
-
What to avoid: Assuming the first version of the map is accurate without confirming it with others.
-
How to avoid it: Conduct review sessions with relevant team members to confirm each step’s accuracy. Use their feedback to refine the flow before final approval or automation.
Inconsistent Symbols and Formatting
-
What to avoid: Using arbitrary shapes, arrows, or color schemes that confuse readers.
-
How to avoid it: Stick to standard process mapping symbols—rectangles for tasks, diamonds for decisions, arrows for flow—and provide a legend for clarity.
Undefined Start and End Points
-
What to avoid: Leaving your process open-ended or circular, which makes it unclear where it begins or ends.
-
How to avoid it: Define explicit start and end points before mapping. This keeps the process contained and prevents overlap with unrelated workflows.
Outdated Maps
-
What to avoid: Allowing workflow diagrams to become obsolete as processes change.
-
How to avoid it: Review and update maps regularly—especially after major organizational, software, or policy shifts.
Documenting Only the "As-Is" Process
-
What to avoid: Stopping at the current state without considering improvements.
-
How to avoid it: Always follow your "as-is" analysis with a "to-be" map that reflects your optimized, future-state process. This forward-looking approach turns mapping into a true driver of continuous improvement.
How Vibe Board S1 Supercharges Workflow Process Mapping
Now that you understand the value of workflow process mapping, the next step is choosing the right tool to bring those workflows to life. Vibe Board S1 is a digital whiteboard that’s also a workflow mapping powerhouse space where you can visualize and refine processes in real time. Built for the way modern teams work, Vibe transforms static diagrams into dynamic, interactive experiences that drive alignment and action across remote, hybrid, and in-person environments.
With its 20-point multi-touch 4K display, you can interact with maps directly—drawing connections, moving elements, and editing steps during real-time collaboration. The AI-powered handwriting recognition feature automatically cleans up sketches and notes. Combined with Vibe’s seamless annotation and presentation tools, you can brainstorm improvements, annotate ideas, and present refined workflows all within a single platform.
Request a demo today!
 Team using a Vibe Board for workflow process mapping in a hybrid meeting
Workflow Process Mapping FAQs
What are the steps in process mapping?
The main steps include defining the process scope and goals, documenting each task and decision in sequence, and validating the draft with stakeholders to ensure accuracy. Once confirmed, you analyze the map for inefficiencies, optimize the workflow, and implement the improved version across teams.
What are the 5 levels of process mapping?
The five common levels are high-level, detailed-level, cross-functional, swimlane, and value stream maps. Each level adds depth and perspective—ranging from big-picture overviews to granular task analysis and interdepartmental collaboration views.
How is a workflow map different from a flowchart?
A workflow map goes beyond simple sequences to show roles, responsibilities, and decision points throughout a process. A flowchart, on the other hand, focuses solely on the linear progression of tasks without contextual details like ownership or cross-functional interactions.
What tools can I use to create workflow process maps?
Popular tools include Lucidchart, Microsoft Visio, Vibe Canvas, Miro, Creately, ClickUp, and Asana. These platforms support various mapping styles, from drag-and-drop flowcharts to collaborative visual canvases, depending on your team’s size and needs.