

The State of Classroom Technology in 2026: What Every District Leader Needs to Know
The classroom technology landscape in 2026 is defined by a paradox: schools have more digital tools than ever, yet many educators feel less equipped to use them effectively. The average U.S. school district now manages 2,982 edtech tools, but this abundance has created new challenges around integration, training, and measurable impact.
This comprehensive guide examines the current state of classroom technology, explores what works (and what doesn't), and provides actionable frameworks for district leaders making technology decisions in 2026.
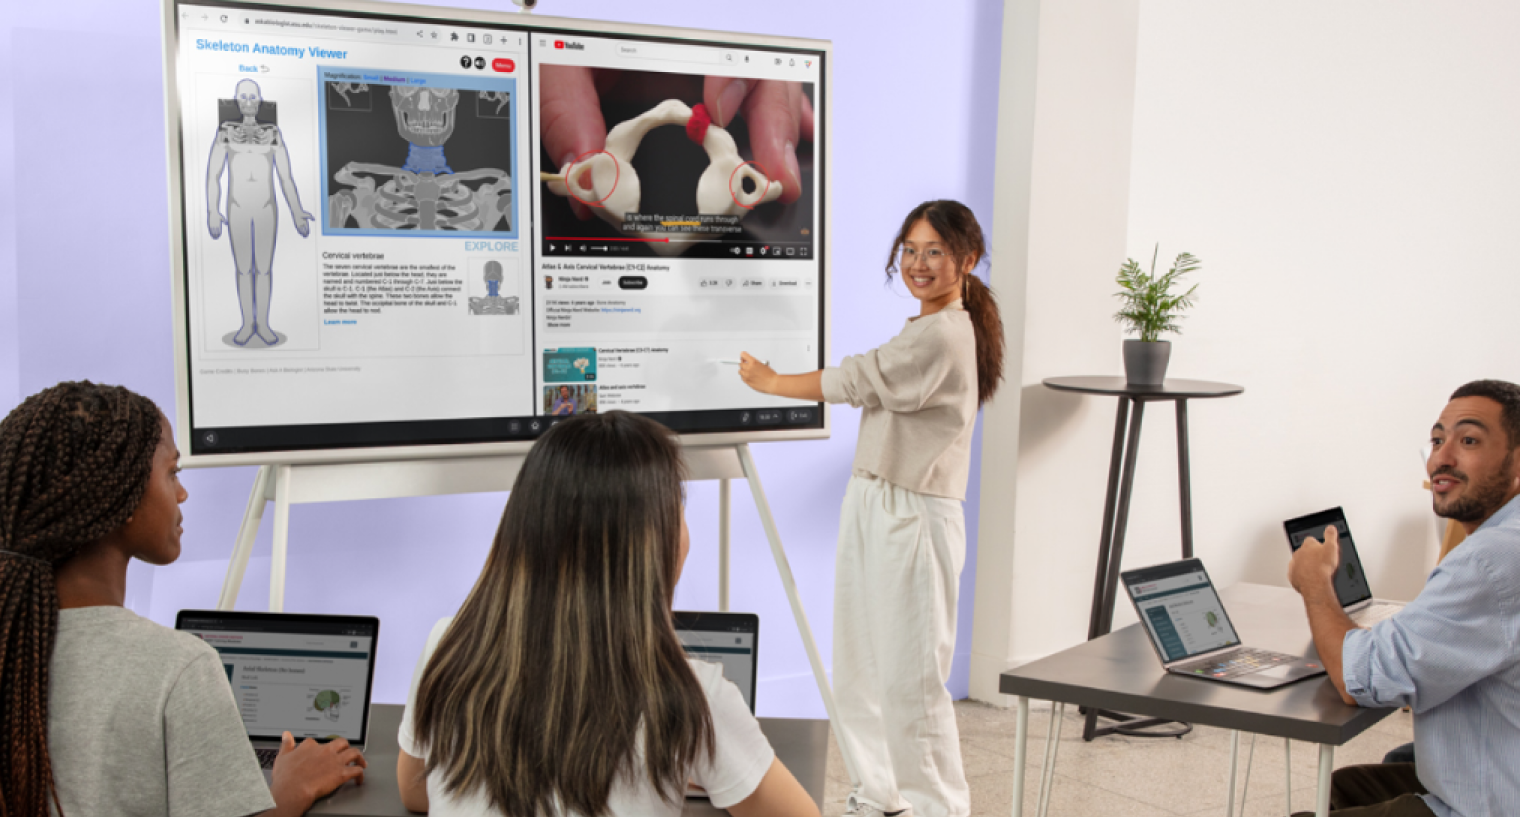 In a collaborative learning environment, a woman stands before a large interactive display, presenting a lesson on human anatomy to several colleagues seated with laptops. The digital screen features a 3D skeleton viewer and an educational video about vertebrae as the group engages in the presentation.
Why Classroom Technology Still Feels Broken
The core problem with classroom technology is not a lack of tools. It is the opposite. U.S. school districts now use an average of 2,982 edtech tools, according to LearnPlatform's 2024/2025 EdTech Top 40 report. Teachers are not under-equipped — they are overwhelmed.
Every new tool promises to transform learning. Few of them talk to each other. The result is a classroom experience that resets every time a teacher switches between applications, devices, or lesson formats. Students lose momentum. Teachers lose time. IT departments lose the ability to maintain, secure, and support what they've deployed.
The Fragmentation Problem
Fragmentation in classroom technology takes three forms:
-
Hardware fragmentation. A single school might use interactive displays from one vendor, document cameras from another, and student tablets from a third. None share a management layer. IT teams maintain separate update cycles, separate support contracts, and separate training programs for each.
-
Software fragmentation. Teachers toggle between an LMS for assignments, a video platform for recorded lessons, a whiteboard app for brainstorming, and a separate assessment tool for quizzes — all from different vendors, with different logins and different interfaces.
-
Experience fragmentation. When hardware and software don't integrate, the classroom experience becomes a patchwork. A teacher who wants to annotate a document, share it to student devices, and save the session for review later may need to touch four different systems to accomplish what should be a single workflow.
What Teachers Actually Experience
Talk to any teacher who has been in the classroom for more than five years, and they will describe a familiar arc: excitement about a new tool, frustration with the onboarding, workarounds to make it fit their workflow, and eventual abandonment.
A 2024 survey by EdWeek Research Center found that 53% of teachers reported using fewer edtech tools than they did two years prior — not because they reject technology, but because the cognitive overhead of managing disconnected tools exceeds the instructional benefit.
The implication for district leaders is clear: the next wave of classroom technology investment should not be about adding tools. It should be about reducing the number of systems teachers need to think about.
 A female teacher is instructing a group of four young students by using a stylus to point at a geometric triangle on a large digital screen. The students stand gathered together, watching the lesson attentively in a classroom setting.
The State of Educational Technology in 2026
Educational technology spending continues to grow, but the character of that spending is shifting. Districts are moving away from broad tool acquisition toward strategic platform investments.
Adoption by the Numbers
The scale of educational technology adoption in U.S. K-12 is significant:
-
$36.6 billion: Total U.S. K-12 edtech spending projected for 2026, according to HolonIQ's Global EdTech Market Intelligence report.
-
2,591 tools per district: Average number of edtech tools accessed monthly across U.S. school districts (LearnPlatform, 2024).
-
89%: Percentage of teachers who use digital tools daily in instruction (ISTE Educator Insights, 2025).
-
42%: Percentage of district IT budgets now allocated to recurring SaaS subscriptions, up from 28% in 2021 (CoSN, 2025).
These numbers reveal a paradox. Technology is everywhere in classrooms — but satisfaction with technology is not proportionally high. The gap between adoption and impact is where district leaders need to focus.
Where Budgets Are Going
Federal ESSER (Elementary and Secondary School Emergency Relief) funds, which drove a wave of pandemic-era technology purchases, have largely expired. Districts are now operating from general fund budgets and E-Rate allocations, which means every dollar faces more scrutiny.
According to CoSN's 2025 IT Leadership Survey, the top three areas of new technology investment for districts are:
-
Cybersecurity infrastructure (68% of districts increasing spend)
-
Interactive classroom displays (54% of districts increasing spend)
-
AI-enabled learning platforms (47% of districts increasing spend)
Notably, interactive display investment has held steady even as other hardware categories (laptops, tablets) have plateaued. District leaders see displays as a long-lifecycle asset — typically 7-10 years — that anchors the physical classroom experience.
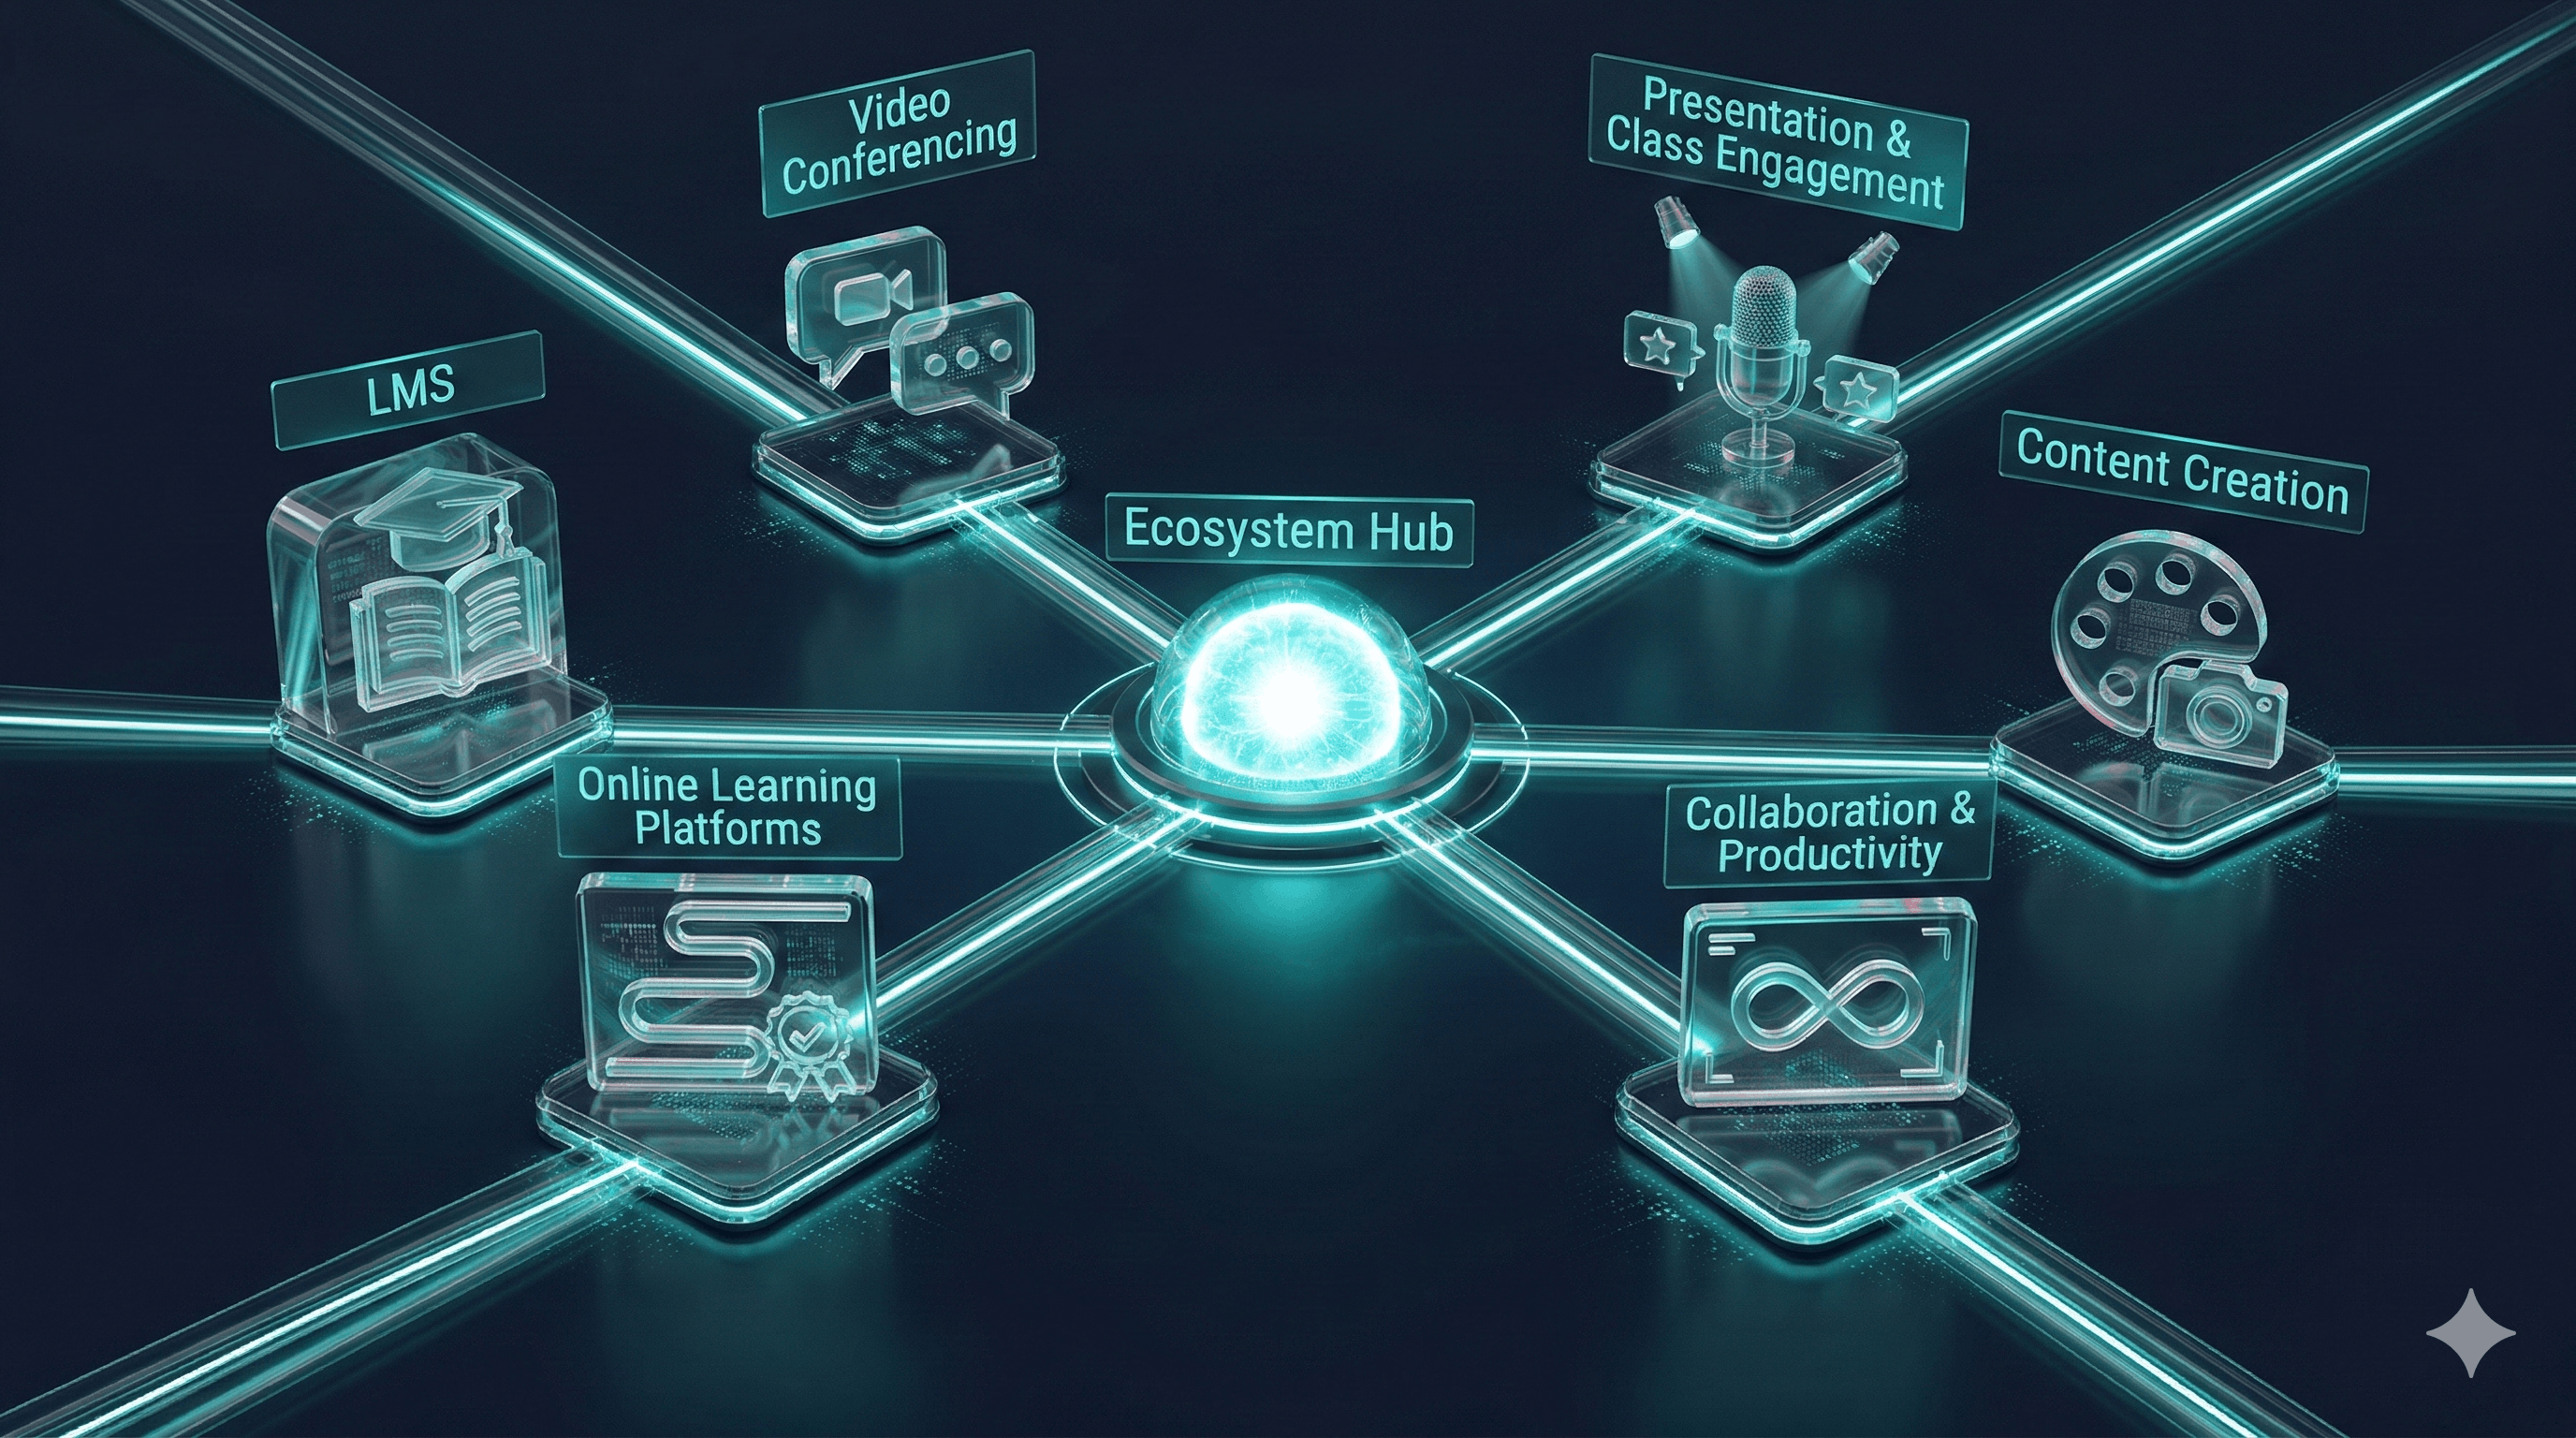 This futuristic graphic depicts a central 'Ecosystem Hub' connected by glowing lines to six distinct categories of digital education tools, including LMS, video conferencing, and content creation. Each category is represented by a stylized holographic icon, illustrating a comprehensive and integrated network of technological resources for learning.
Classroom Technology Categories: A Complete Breakdown
The classroom technology landscape spans six major categories. Understanding what each category does — and where it falls short — is essential for making informed purchasing decisions.
Comparison Table: Classroom Technology Categories
|
Category |
Primary Function |
Typical Lifespan |
Integration Complexity |
Budget Impact |
Key Consideration |
|---|---|---|---|---|---|
|
Interactive Displays |
Whole-class instruction, annotation, collaboration |
7–10 years |
Medium–High |
$3,000–$8,000/unit |
Software ecosystem matters more than panel specs |
|
Student Devices (1:1) |
Individual learning, assessment, creation |
3–4 years |
Medium |
$200–$500/unit |
Management and security at scale |
|
Learning Management Systems |
Assignment distribution, grading, communication |
Subscription |
Low–Medium |
$3–$8/student/year |
Teacher adoption is the bottleneck |
|
Collaboration Platforms |
Real-time co-creation, video, messaging |
Subscription |
Medium |
$0–$6/user/year |
Must bridge in-room and remote |
|
AI Learning Tools |
Adaptive practice, content generation, tutoring |
Subscription |
High |
$5–$15/student/year |
Data privacy and efficacy validation |
|
Assessment & Analytics |
Testing, progress monitoring, data visualization |
Subscription |
Medium–High |
$4–$12/student/year |
Interoperability with SIS/LMS |
Interactive Displays and Smart Boards
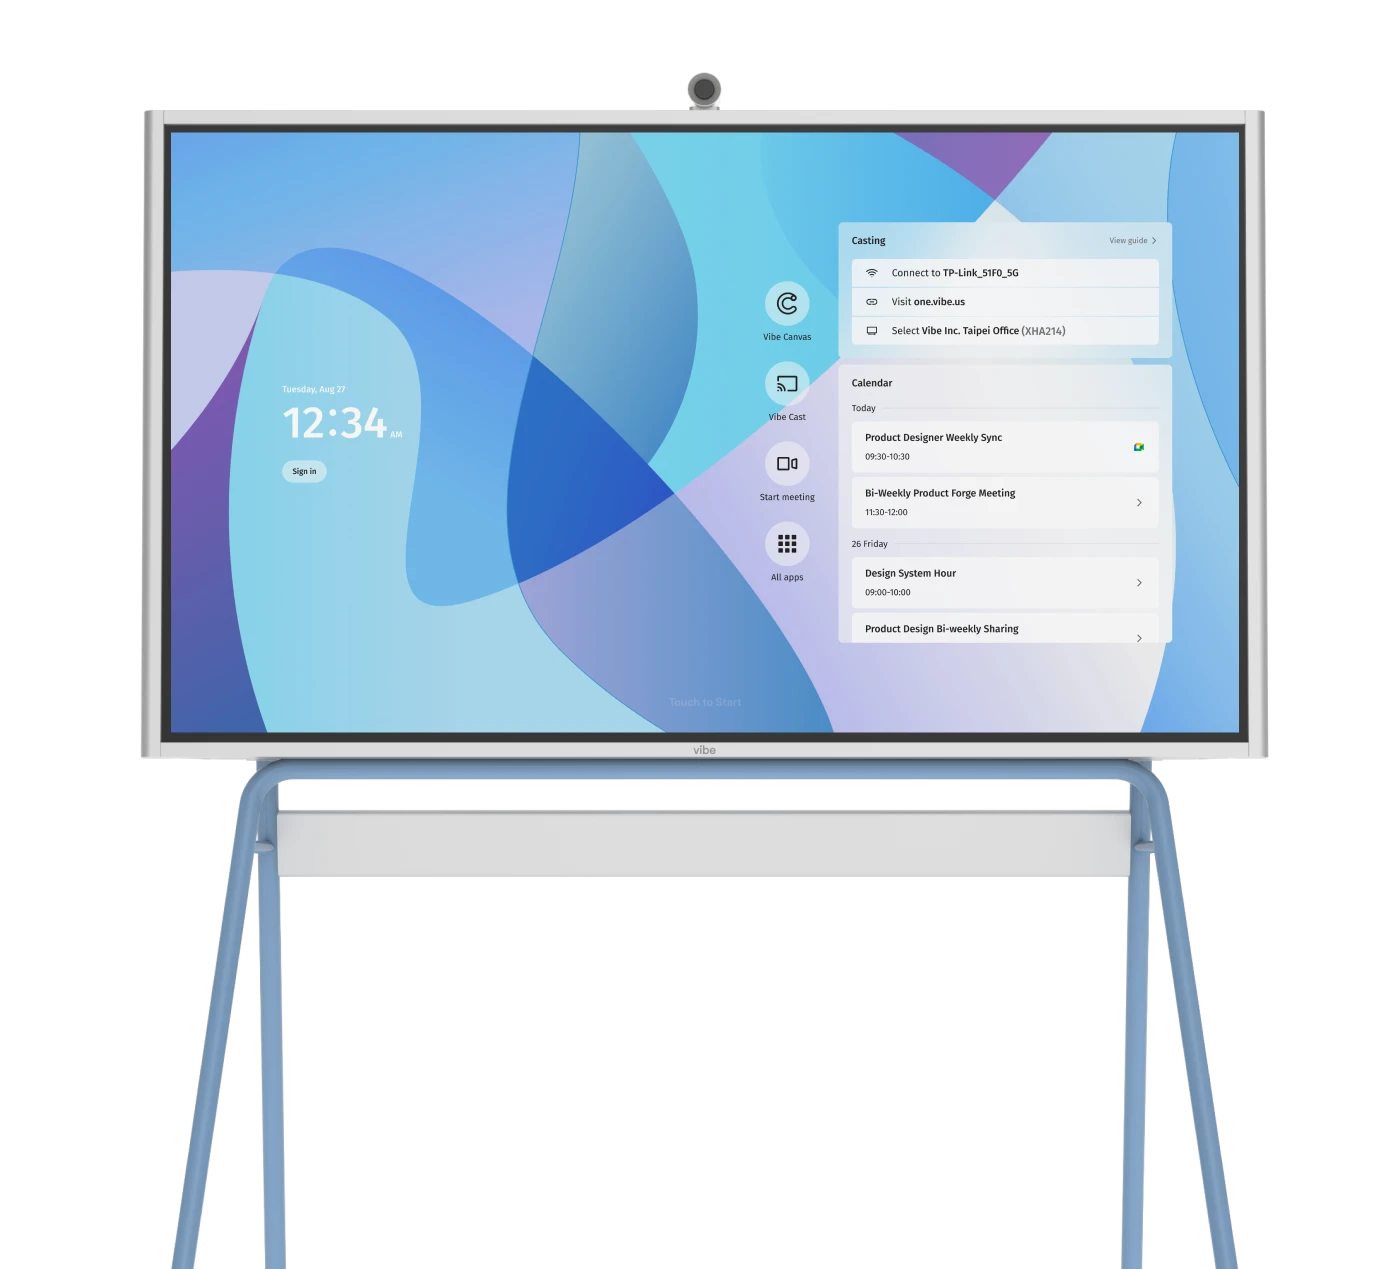
Interactive displays are the centerpiece of the modern classroom. They have replaced projectors in most new installations and are increasingly replacing traditional whiteboards as well.
The category has evolved significantly. Early interactive whiteboards were essentially touch-enabled projection screens. Today's interactive displays are standalone computing platforms with built-in operating systems, wireless casting, cloud storage, and app ecosystems.
The critical distinction to understand in 2026 is the difference between a display and a workspace. A display shows content. A workspace lets teachers and students create, annotate, save, and share — all from the same surface, without switching applications. Districts that evaluate interactive displays purely on panel size, resolution, and touch points are missing the factor that most determines daily classroom value: the software experience that lives on the display.
For a deeper comparison of leading interactive display vendors, see our guide on comparing interactive display vendors.
Student Devices and 1:1 Programs
The 1:1 device model — one laptop or tablet per student — is now standard in most U.S. districts. Chromebooks dominate, holding roughly 60% of the K-12 device market by unit volume.
The challenge in 2026 is not deployment but management. Districts need device management (MDM) solutions that handle updates, security policies, content filtering, and application provisioning across thousands of endpoints. The total cost of ownership for a 1:1 program extends far beyond the hardware purchase price.
Learning Management Systems (LMS)
Learning management systems — Canvas, Google Classroom, Schoology — serve as the digital backbone of course delivery. Nearly every district uses one.
The LMS category is mature but not solved. Teacher adoption remains uneven, with power users building rich course structures and others using the LMS as little more than a digital filing cabinet. The key evaluation criterion in 2026 is not feature count but integration depth: how well does the LMS connect to the other tools teachers already use?
Collaboration and Communication Platforms
This category includes tools like Google Workspace for Education, Microsoft Teams for Education, and purpose-built classroom collaboration tools. The pandemic accelerated adoption, and these platforms have become permanent infrastructure.
The gap in this category is bridging physical and digital collaboration. Most platforms assume participants are on individual screens. Fewer are designed to work seamlessly with a shared classroom display, which is how most in-person instruction actually happens.
AI-Powered Learning Tools
AI is the fastest-growing and least understood category in classroom technology. Tools range from adaptive math practice platforms (like Khan Academy's Khanmigo) to AI writing assistants to automated grading systems.
District leaders should approach AI tools with informed skepticism. The Gartner 2025 Hype Cycle for Education places generative AI in the "Peak of Inflated Expectations" phase, meaning widespread productive deployment is likely still 2-5 years away for most districts. Pilot carefully. Demand efficacy data. Ensure compliance with student data privacy regulations before any deployment.
Assessment and Analytics Platforms
Assessment platforms (MAP Growth, iReady, Renaissance Star) provide the data that drives instructional decisions. The category is well-established but faces pressure to deliver faster, more actionable insights.
The integration challenge here is connecting assessment data to instruction. A test score that lives in a separate dashboard from the LMS and the classroom display creates extra steps for teachers. The most effective implementations connect assessment insights directly to the tools teachers use during instruction. For more on student response systems and engagement tools, explore our dedicated guide.
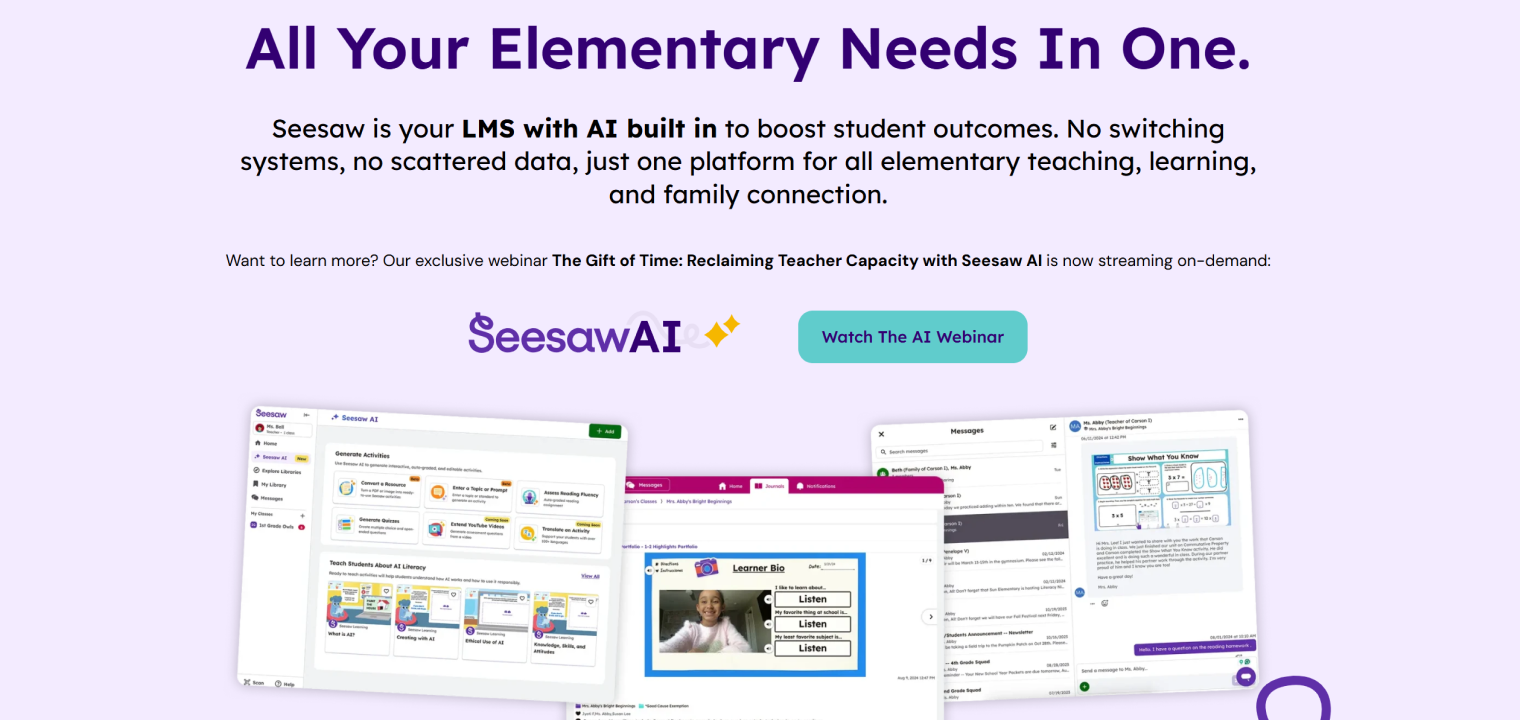 This promotional graphic showcases Seesaw AI, an educational platform designed for elementary schools. The scene features bold text advertising integrated AI tools alongside overlapping screenshots of the platform's interface, which includes activity generators, student portfolios, and messaging features. A prominent teal button encourages viewers to watch a webinar about the technology.
What District IT Leaders Should Prioritize in 2026
With post-pandemic urgency fading and budgets tightening, district IT leaders need a clear prioritization framework. Here are the four areas that will deliver the most value.
Standardization Over Novelty
The single highest-impact decision a district can make is reducing tool sprawl. Every additional tool in the ecosystem carries costs: licensing, training, support, security review, and integration maintenance.
Standardization does not mean using one tool for everything. It means establishing a core platform stack — typically a display platform, an LMS, a device management solution, and a collaboration suite — and requiring that any new tool integrates with that stack before approval.
Learn more about standardizing classroom technology across schools.
Integration as a Non-Negotiable
Every tool in the classroom should pass an integration test before purchase:
-
Does it support LTI (Learning Tools Interoperability) standards?
-
Does it authenticate through the district's SSO provider?
-
Does it share data through the district's SIS (Student Information System)?
-
Does it work on the classroom's primary display without workarounds?
If the answer to any of these is "no," the tool should require an exception approval with a documented justification.
Teacher Experience Before Student Features
A common mistake in edtech procurement is evaluating tools based on student-facing features while ignoring the teacher workflow. The teacher is the deployment vector. If a tool is difficult for teachers to set up, manage, and integrate into their practice, student adoption will fail regardless of how engaging the student experience is.
Evaluation teams should include teachers in every pilot. The key question is not "is this tool impressive in a demo?" but "would a teacher with 25 minutes of prep time actually use this tomorrow?"
Security and Compliance at Scale
Cybersecurity incidents in K-12 have increased 400% since 2018, according to the K-12 Security Information Exchange (K12 SIX). Every tool that touches student data is an attack surface.
District IT leaders in 2026 should require:
-
SOC 2 Type II compliance for any cloud vendor
-
Student Data Privacy Consortium (SDPC) agreement signing
-
Regular third-party penetration testing documentation
-
Clear data deletion policies upon contract termination
 In a bright, modern office with large glass windows, a group of professionals is conducting a collaborative meeting. One woman stands at a large interactive display presenting data visualizations and a video conference, while her colleagues observe and work from a table equipped with laptops.
How to Evaluate Classroom Technology for Your District
The 5-Point Evaluation Framework
Use this framework for any classroom technology purchase decision, aligned with ISTE Standards for Education Leaders:
-
Integration fit. Does it connect to your existing stack (LMS, SIS, SSO, display platform)?
-
Teacher adoption likelihood. Can a typical teacher use it effectively within one week?
-
Total cost of ownership. What does it cost over 5 years including training, support, and integration?
-
Security posture. Does the vendor meet your district's data privacy and security requirements?
-
Evidence of impact. Can the vendor provide peer-reviewed or independent evidence of learning outcomes?
Score each criterion on a 1-5 scale. Any tool scoring below 3 on integration fit or security posture should be automatically disqualified.
For detailed pricing considerations, visit our pricing page to understand total cost structures.
Total Cost of Ownership
Hardware purchases are the most visible cost, but rarely the largest. For a classroom interactive display, the 5-year TCO typically breaks down as:
Districts that evaluate only the hardware price are making decisions on less than half the actual cost.
Pilot Programs That Actually Work
Effective pilots share three characteristics:
-
Defined success criteria before launch. What specific outcomes will determine whether the pilot succeeds? Agree on metrics before the pilot starts.
-
Representative participants. Include teachers across experience levels, comfort with technology, and subject areas. A pilot that only includes enthusiastic early adopters will not predict district-wide adoption.
-
Sufficient duration. A two-week pilot captures novelty effects. A semester-long pilot captures reality. Budget accordingly.
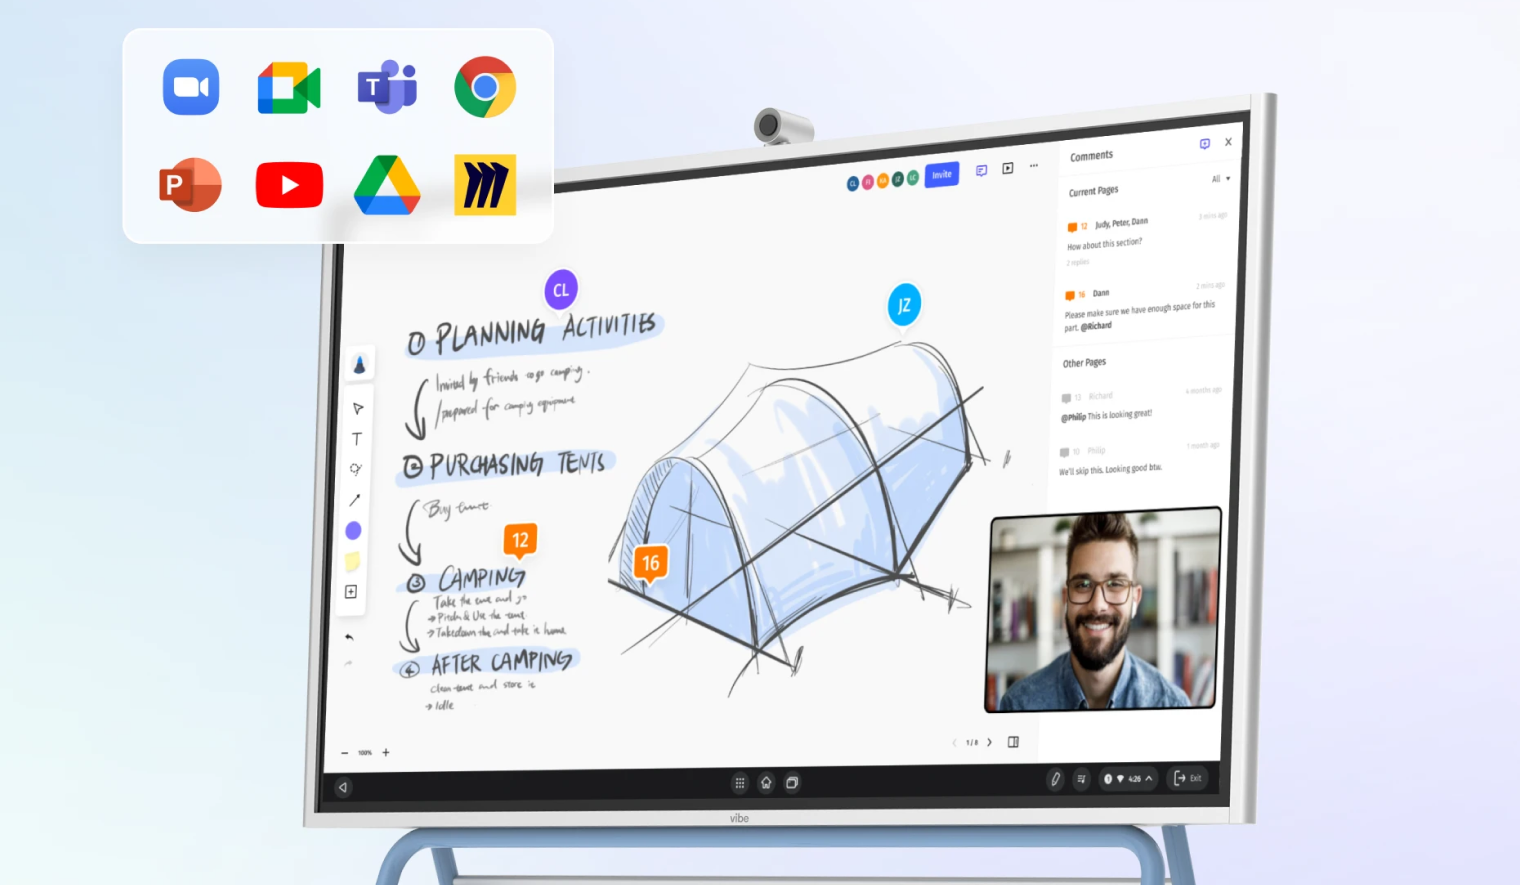 This image shows an interactive digital whiteboard displaying a collaborative design project for planning a camping trip. The screen features a 3D sketch of a tent alongside handwritten notes, a live video call window, and a sidebar for comments. Floating icons for various productivity and communication apps are shown in the upper corner, highlighting the display's integrated software capabilities.
The Shift from Display to Workspace
Why Hardware Vendors Are Rethinking the Category
The interactive display market has historically competed on hardware specifications: screen size, resolution, touch points, brightness. These specifications have largely converged. A 75-inch 4K interactive display from any major vendor will have comparable panel quality, according to Futuresource Consulting.
The differentiation has moved to software. The question is no longer "how good is the screen?" but "what can teachers and students do on it — and how seamlessly does that work connect to everything else they use?"
This represents a category shift from interactive display to interactive workspace. A workspace is not just a surface for presentation. It is a persistent environment where work is created, saved, shared, and continued across sessions and devices.
The Case for a Unified Collaboration Platform
The most promising development in classroom technology is the emergence of platforms that unify the display surface with the collaboration experience. Rather than using the display as a passive screen that mirrors a laptop, these platforms treat the display as the primary workspace — where teachers and students annotate, brainstorm, and build together in real time.
This approach directly addresses the fragmentation problem. When the display, the whiteboarding tool, the screen-sharing capability, and the cloud storage are part of a single platform, teachers don't toggle between apps. Students don't lose context. IT doesn't manage five separate vendor relationships for what should be a single workflow.
Vibe's approach to this problem — building a collaboration workspace rather than just an interactive display — reflects where the category is heading. The Vibe Board combines an infinite canvas, built-in video conferencing, app integrations, and cloud persistence into a single platform that works the same way whether participants are in the room or remote. It's the kind of unified experience that eliminates the "classroom reset" problem: when a teacher finishes a session, the work is saved and shareable, not erased.
For district leaders evaluating interactive displays, the key question to ask any vendor is: "What happens to the work after the lesson ends?" If the answer involves exporting files, switching apps, or manual saving, the tool is a display. If the answer is "it's already saved and accessible from any device," the tool is a workspace.
For more guidance on selecting the right interactive display, see our smart board buying guide.
Implementation Roadmap for District-Wide Technology
Rolling out new classroom technology at scale requires a phased approach. Rushing deployment leads to underutilization and teacher frustration. Here is a proven four-phase roadmap.
Phase 1 — Audit and Alignment (Months 1-2)
-
Inventory all current classroom technology (hardware and software)
-
Survey teachers on current tool usage, satisfaction, and pain points
-
Map integration relationships between existing systems
-
Define strategic goals for the technology refresh (tie to instructional priorities, not technology trends)
-
Establish evaluation criteria using the 5-point framework above
Phase 2 — Pilot and Validate (Months 3-5)
-
Select 3-5 pilot schools representing district diversity
-
Deploy candidate solutions with full training support
-
Collect structured feedback biweekly
-
Measure against pre-defined success criteria
-
Document integration issues and resolution paths
Phase 3 — Rollout and Training (Months 6-12)
-
Phase deployment by school cluster (don't deploy everywhere simultaneously)
-
Provide tiered training: basic (all teachers), intermediate (willing adopters), advanced (champions)
-
Assign building-level technology coaches for first 90 days
-
Maintain a rapid-response support channel for the first semester
Phase 4 — Measure and Iterate (Ongoing)
-
Track usage data monthly (not just deployment — actual usage)
-
Conduct teacher satisfaction surveys quarterly
-
Review TCO against projections annually
-
Retire underperforming tools actively (sunsetting is as important as adopting)
Frequently Asked Questions
What is classroom technology?
Classroom technology refers to any digital tool used in an educational setting to support teaching and learning. This includes hardware (interactive displays, student laptops, document cameras), software (learning management systems, assessment platforms, collaboration tools), and infrastructure (networking, device management, content filtering). In 2026, the term increasingly refers to integrated platforms rather than individual devices.
How much does classroom technology cost per classroom?
Costs vary widely depending on the technology stack. A basic setup with an interactive display and existing student devices typically costs $4,000-$8,000 per classroom for hardware, plus $500-$1,500 per classroom annually for software subscriptions. A fully modernized classroom with new displays, refreshed devices, and a comprehensive software stack can cost $15,000-$25,000 per classroom in the first year. Districts should evaluate 5-year total cost of ownership rather than upfront hardware costs alone.
What is the difference between an interactive display and a smart board?
"Smart board" is often used generically but is technically a brand name (SMART Technologies). Interactive display is the category term for any large touchscreen display used in classrooms. Modern interactive displays have moved beyond the original smart board concept — they are standalone computing devices with built-in operating systems, wireless connectivity, and app ecosystems, rather than accessories that require a connected computer and projector.
How do I get teacher buy-in for new classroom technology?
Teacher buy-in depends on three factors: involvement in the selection process, adequate training time, and visible reduction in daily friction. Include teachers in pilot programs and evaluation committees. Provide at least 10 hours of hands-on professional development before expecting adoption. Most importantly, choose technology that simplifies existing workflows rather than adding new ones. Teachers adopt tools that save them time; they resist tools that cost them time.
What should a district IT director prioritize when modernizing classroom technology?
Prioritize integration and standardization over feature richness. The most common failure mode in district technology is deploying powerful tools that don't connect to each other. Start by establishing a core platform stack (display + LMS + devices + collaboration suite), then evaluate any new tool against its ability to integrate with that stack. Security compliance should be a prerequisite, not an afterthought.
Is AI replacing teachers in the classroom?
No. AI tools in education are augmenting teacher capabilities, not replacing teachers. The most effective AI implementations handle routine tasks — adaptive practice, automated grading of objective assessments, content differentiation — freeing teachers to focus on relationship-building, discussion facilitation, and complex skill development that AI cannot replicate. Gartner projects that by 2028, AI will automate approximately 20% of routine instructional tasks, but teacher-led instruction will remain central to effective learning.
How long does it take to implement new classroom technology district-wide?
A responsible district-wide rollout takes 9-18 months from initial evaluation to full deployment. This includes 1-2 months for auditing and planning, 2-3 months for piloting, and 6-12 months for phased rollout with training. Districts that attempt to compress this timeline typically experience lower adoption rates and higher support costs. Budget for at least one full academic year from pilot start to district-wide deployment.
What is the ROI of classroom technology?
ROI in education technology is difficult to measure in purely financial terms. The most meaningful metrics are teacher time savings (measured in hours per week reclaimed from administrative tasks), student engagement (measured through usage data and classroom observation), and learning outcomes (measured through assessment data). Districts that standardize on integrated platforms typically report 3-5 hours per week in teacher time savings and measurable improvements in student engagement metrics within the first year.
Final Takeaway
- The core problem is not lack of tools but fragmentation — districts use an average of 2,982 edtech tools that don't integrate
- Prioritize standardization and integration over feature count when evaluating new classroom technology
- The category is shifting from interactive displays to unified collaboration workspaces that persist work across sessions
- Successful district-wide implementation requires 9-18 months with phased rollout and comprehensive teacher training
- Evaluate total cost of ownership over 5 years, not just upfront hardware costs
The state of classroom technology in 2026 is defined by a paradox: more tools, less coherence. Districts have invested heavily in technology, but the return on that investment is limited by fragmentation — tools that don't integrate, workflows that don't persist, and experiences that reset every time someone switches an app.
The path forward is not more technology. It is better-connected technology. District leaders who prioritize standardization, integration, and teacher experience over feature lists and spec sheets will build classrooms where technology genuinely serves instruction rather than competing with it.
The shift from isolated displays to unified collaboration workspaces represents the most significant category evolution in classroom technology this decade. When the display becomes the workspace — where content is created, shared, saved, and continued seamlessly — the fragmentation problem starts to dissolve.
That is the standard classrooms deserve. And it is achievable today.
Ready to see how a unified collaboration platform works in your classrooms? Explore Vibe Board for Education or schedule a demo to experience the difference firsthand. For comprehensive education solutions, discover how Vibe transforms learning environments.