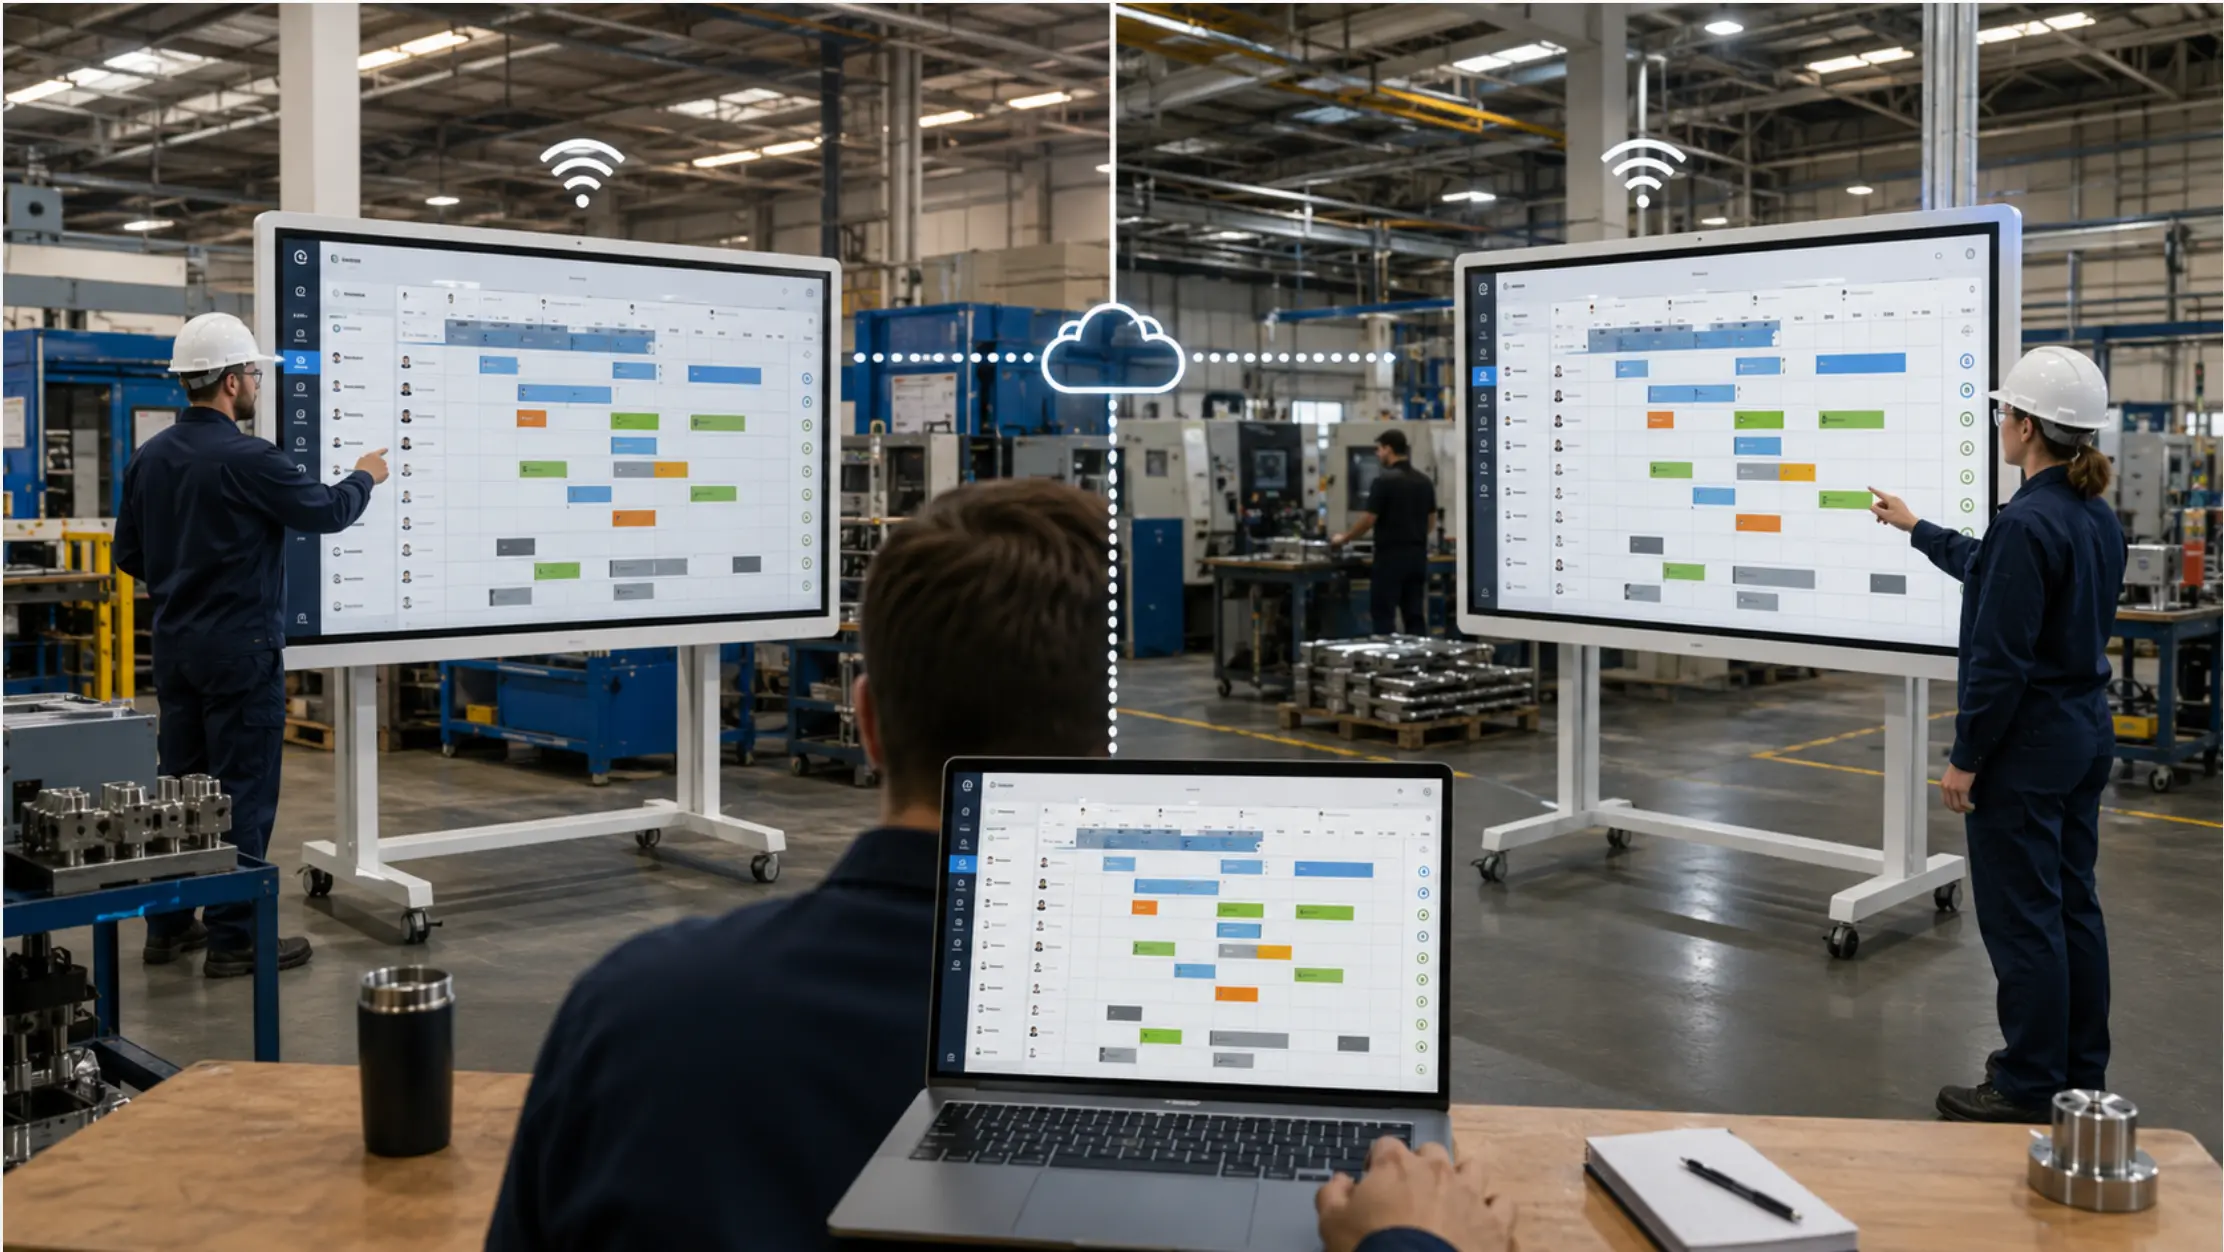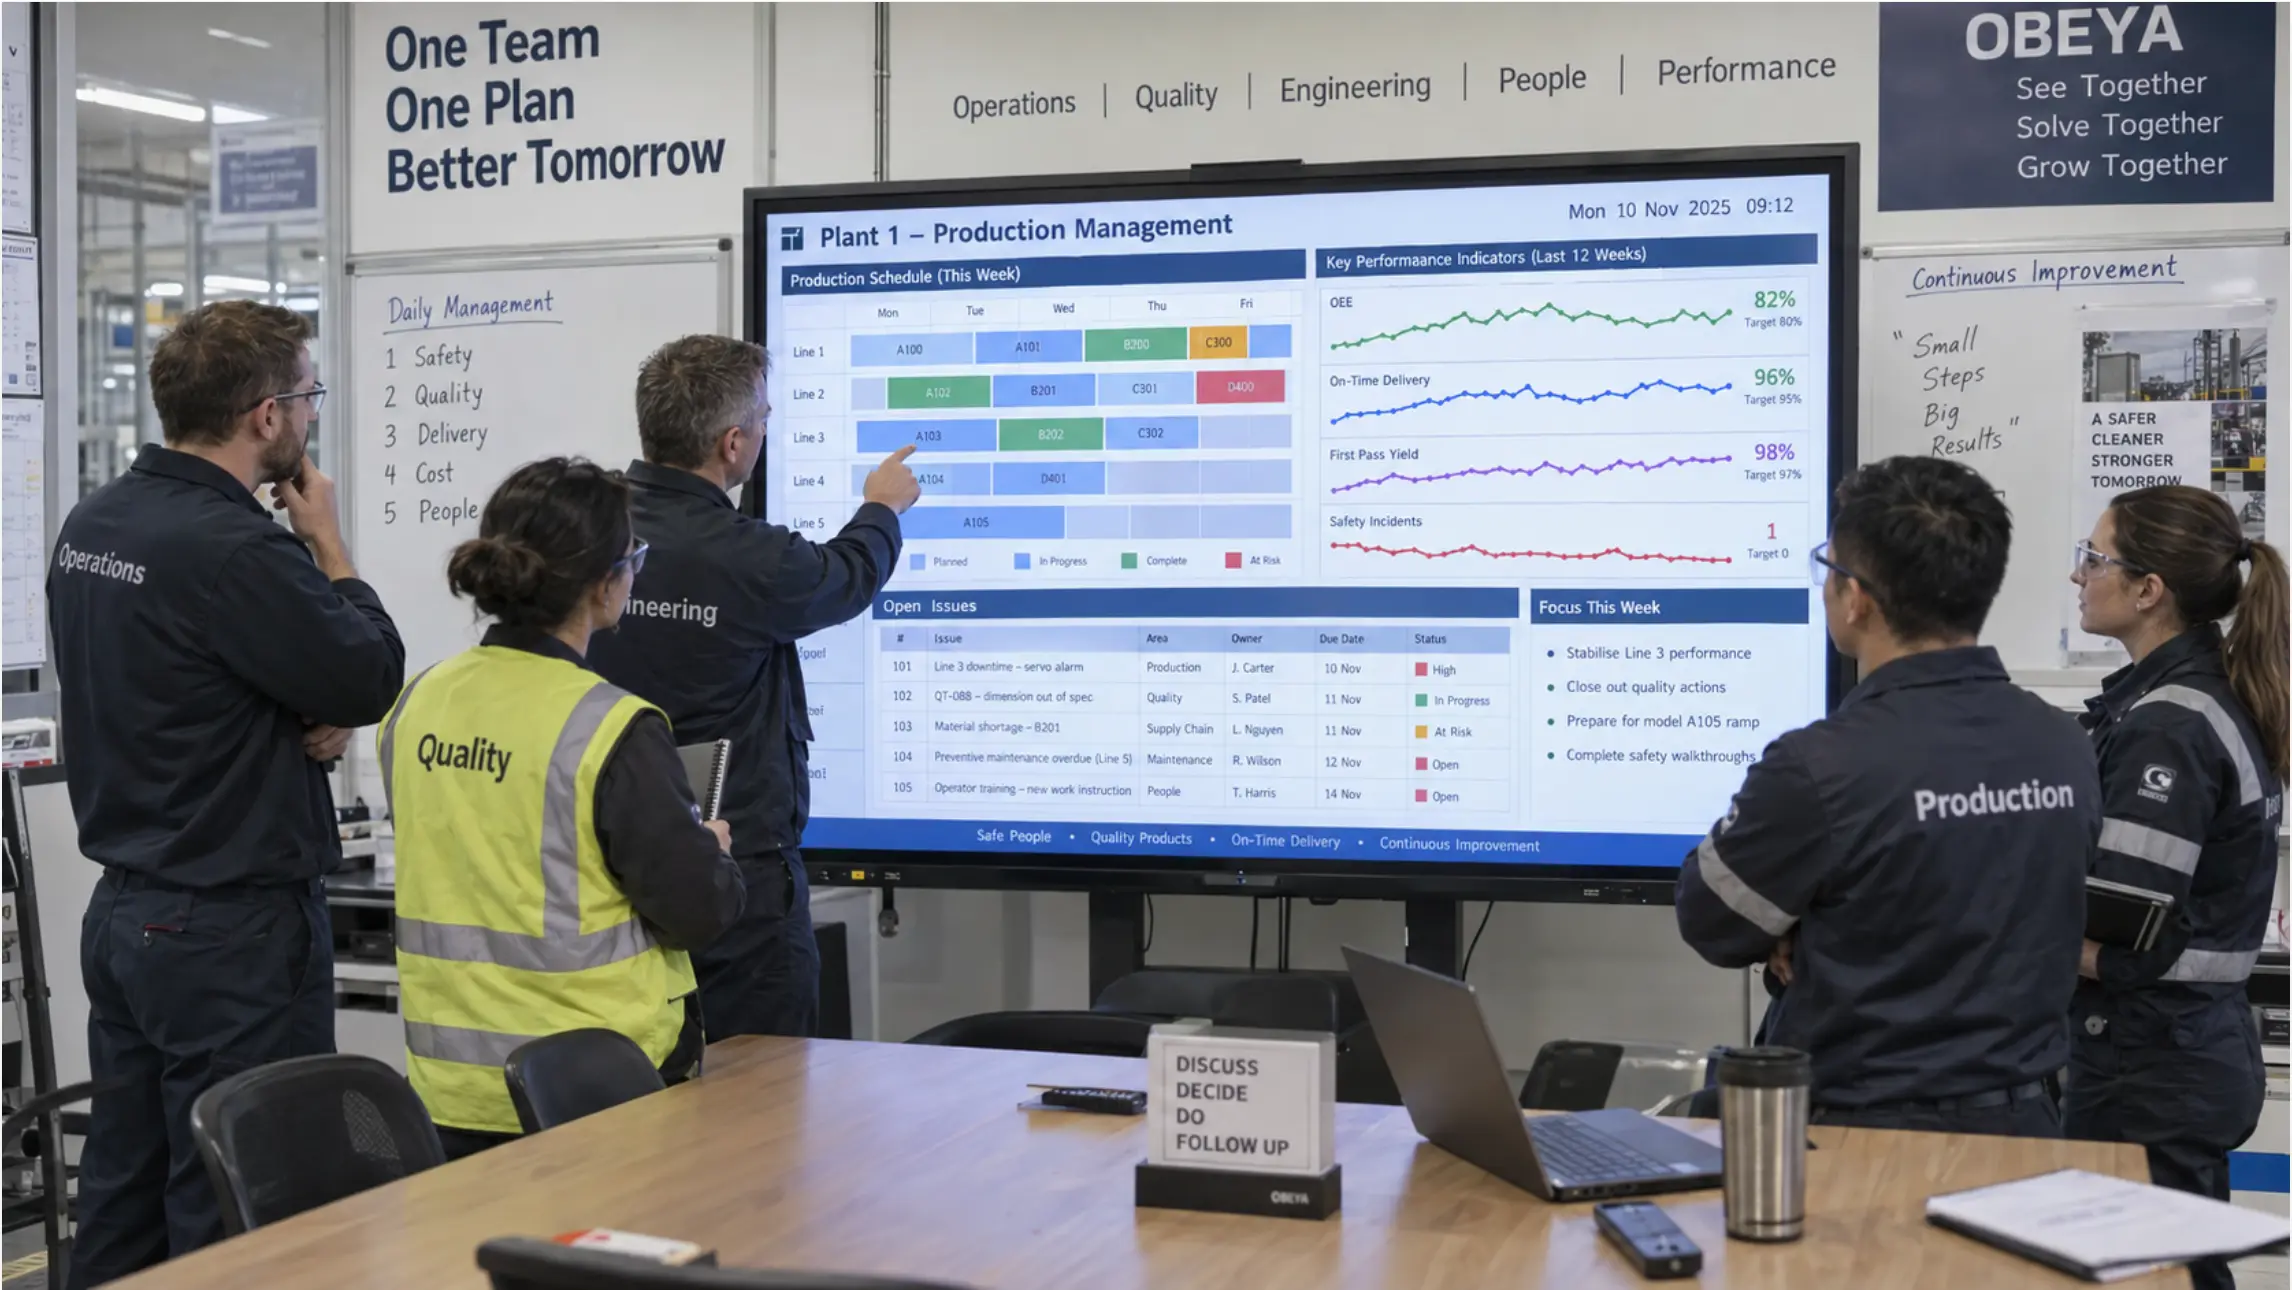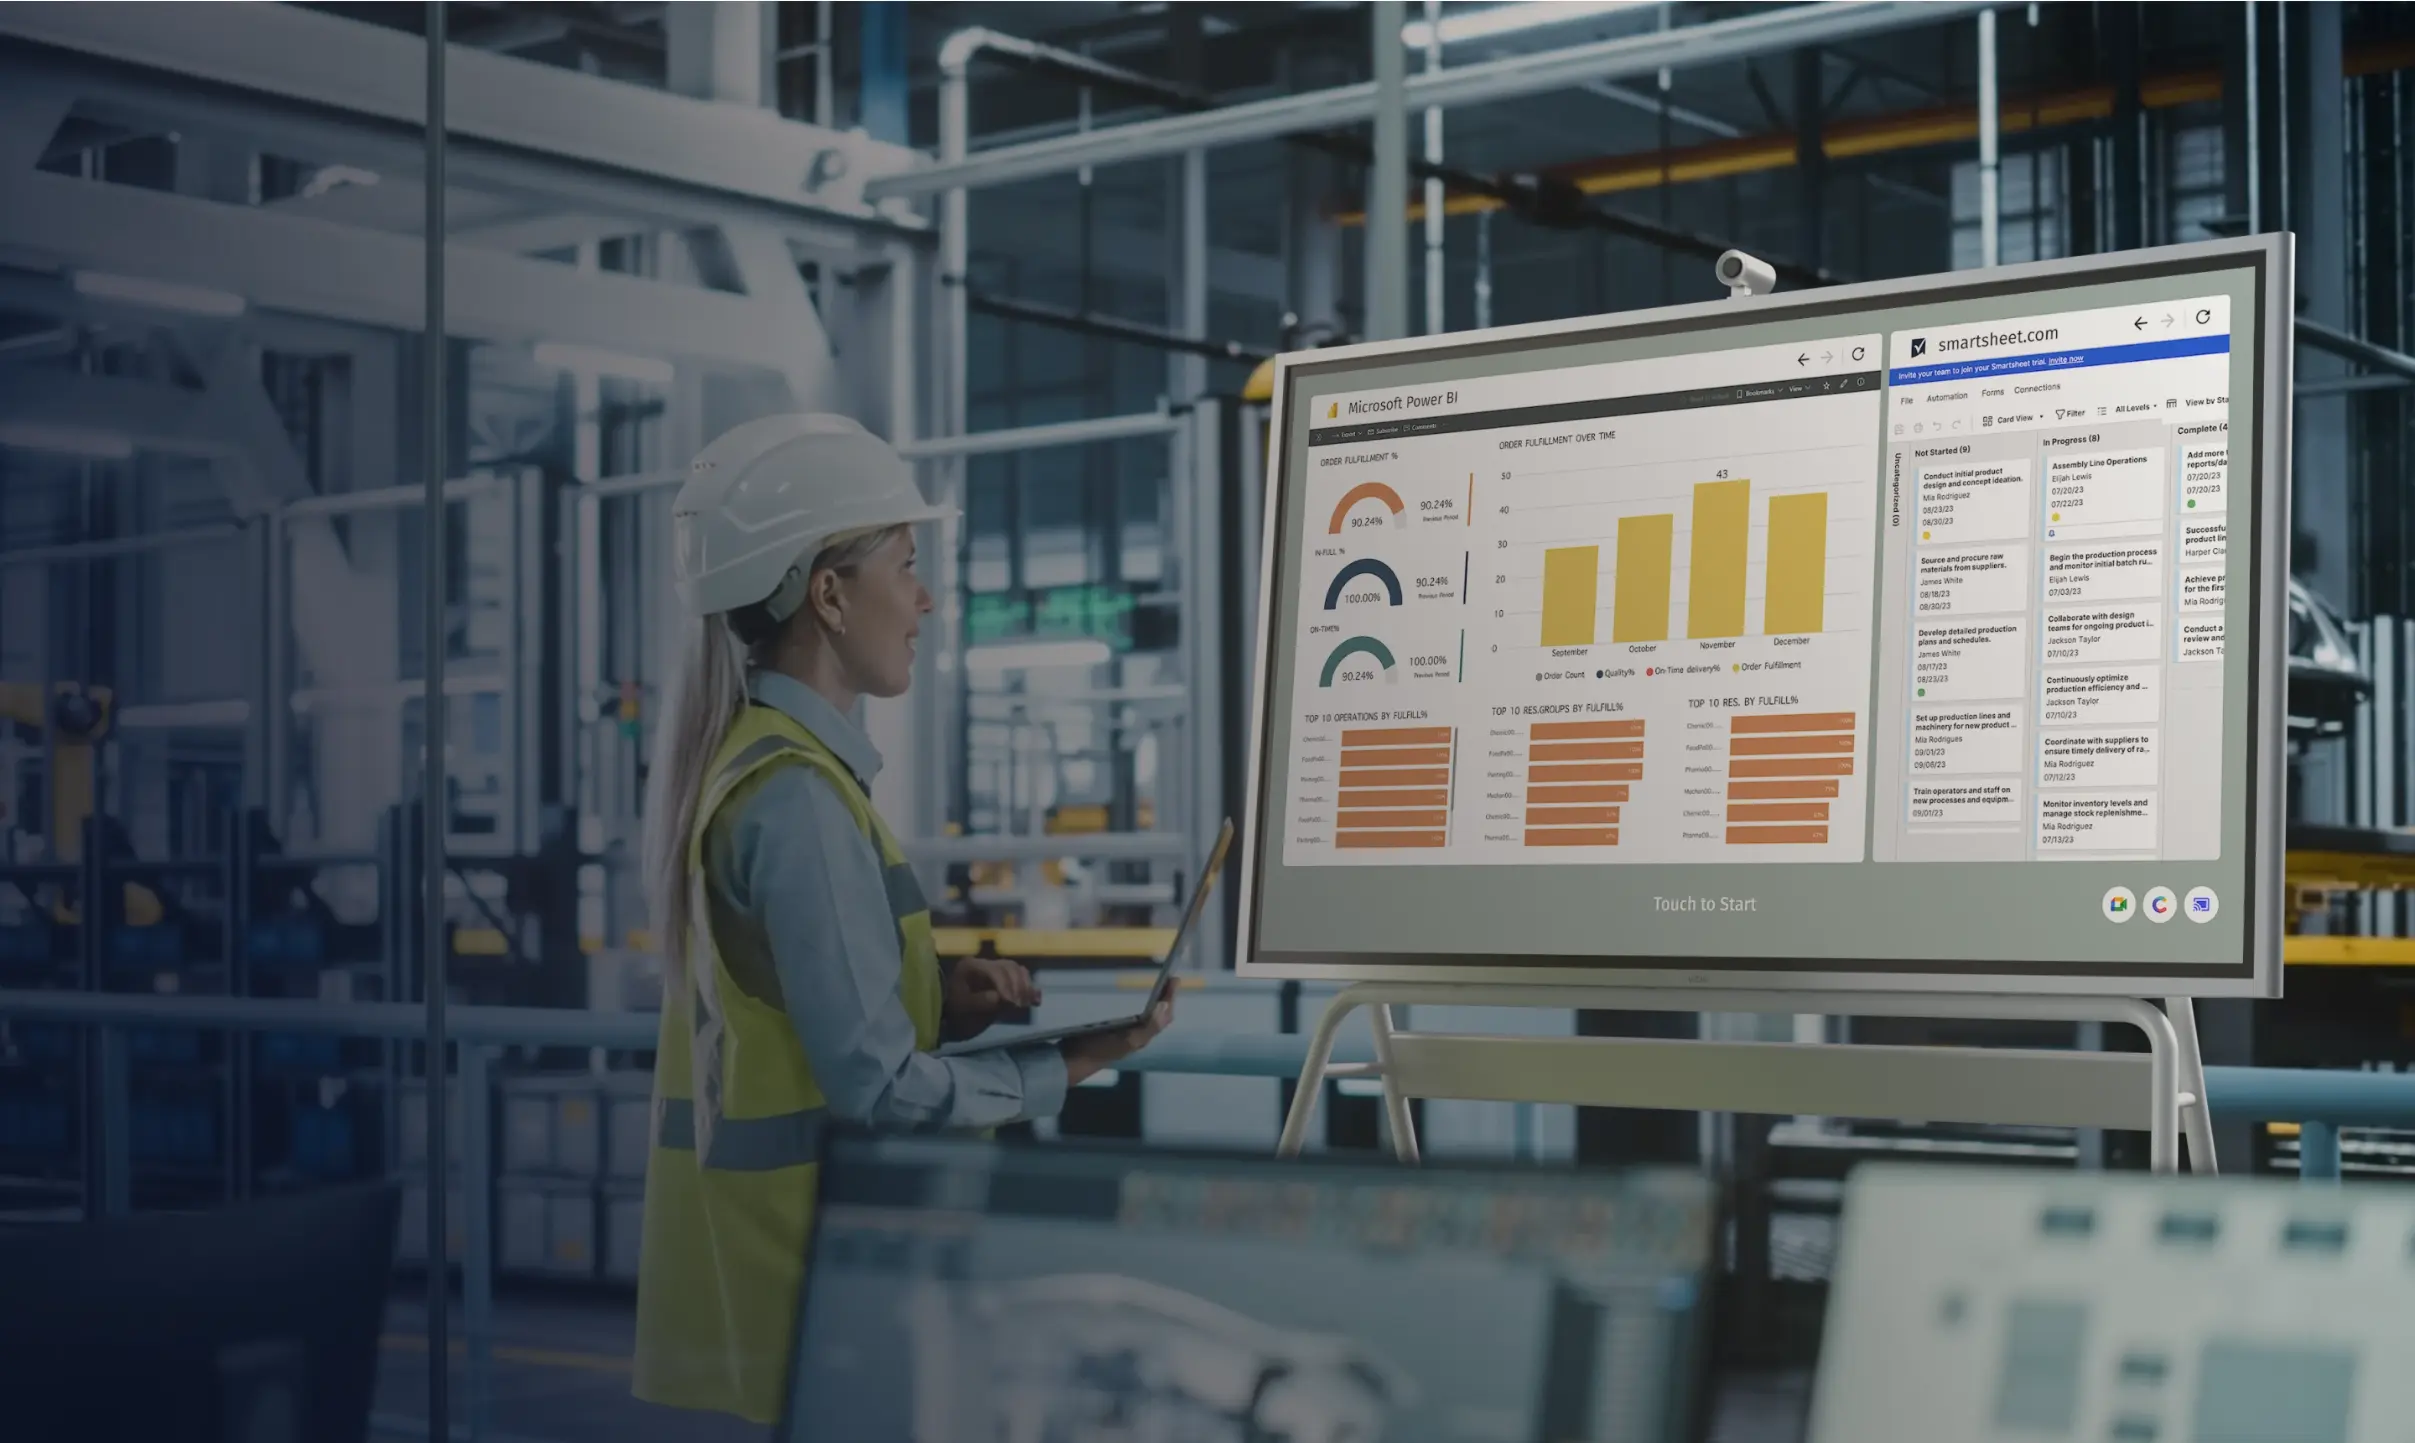

When a line stops or output falls behind pace, the question is never whether there’s a problem — it’s how quickly the right person finds out. On most shop floors today, that answer is still "too slowly." Supervisors walk the floor. Operators wait to be noticed. By the time a fault reaches someone who can act on it, minutes of production time are already gone.
A digital andon board changes that dynamic. It puts real-time line status, alert conditions, and production KPIs on a shared screen where everyone — from the operator at the workstation to the shift manager at the end of the aisle — can see exactly what’s happening, right now.
This guide covers what a digital andon board is, how it works, what it should display, and how to set one up without replacing the data systems you already run.
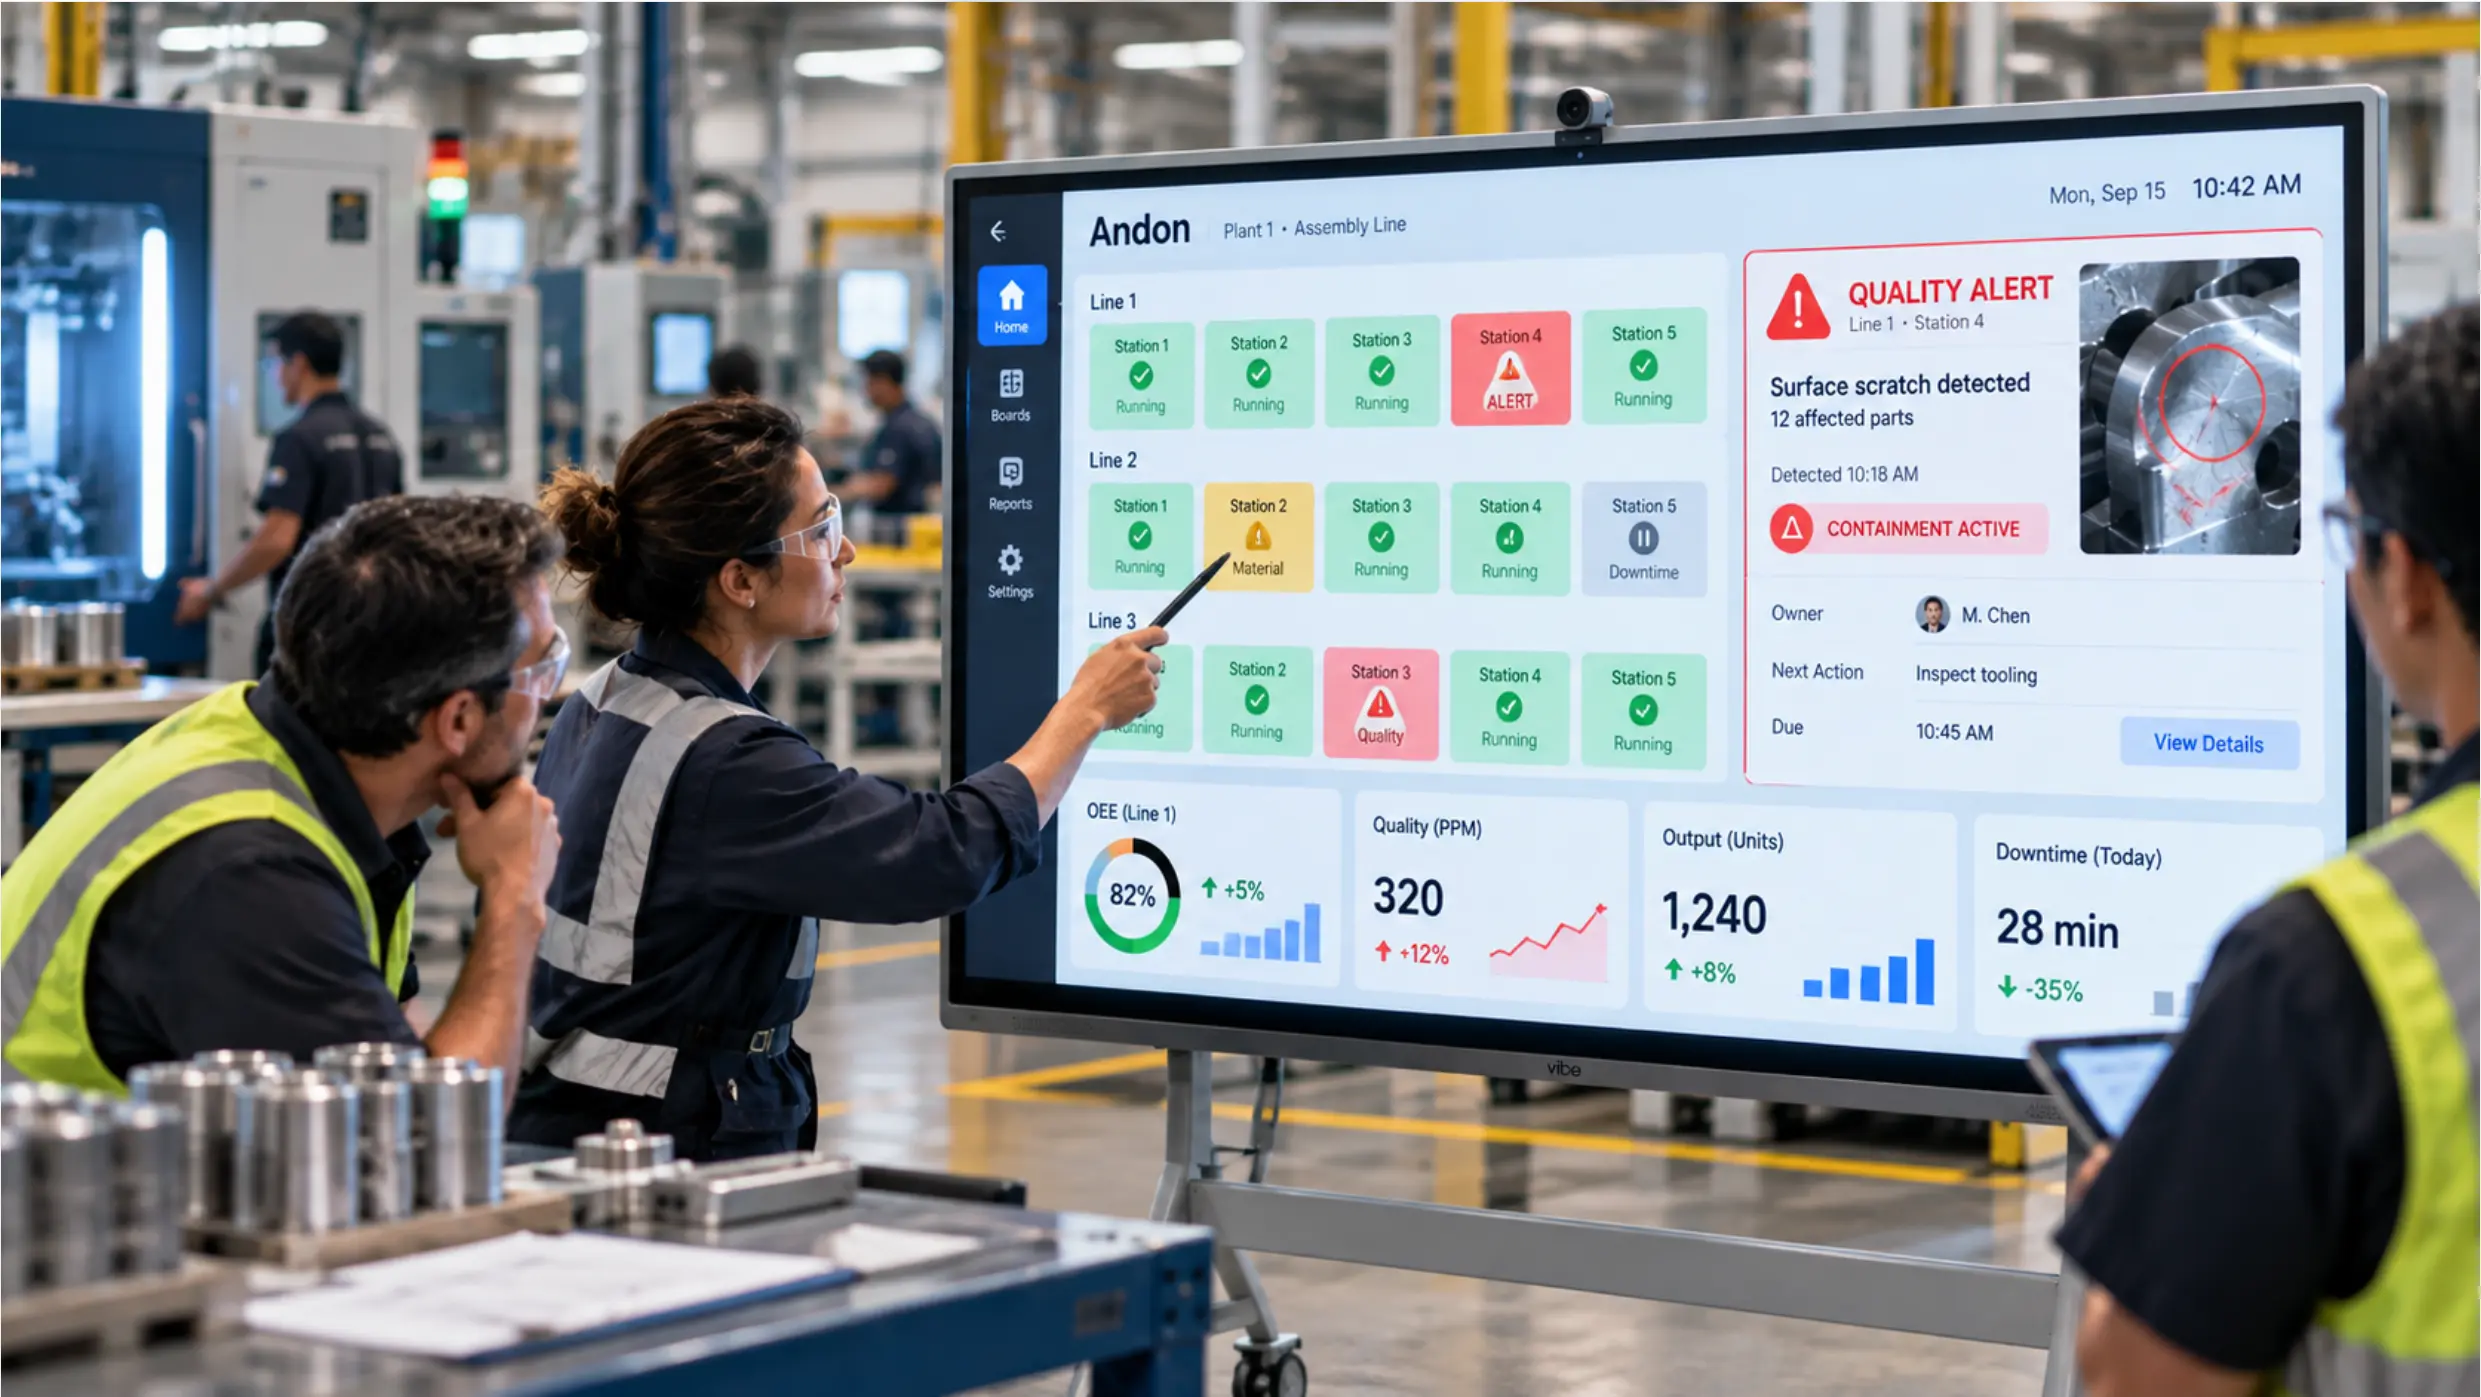
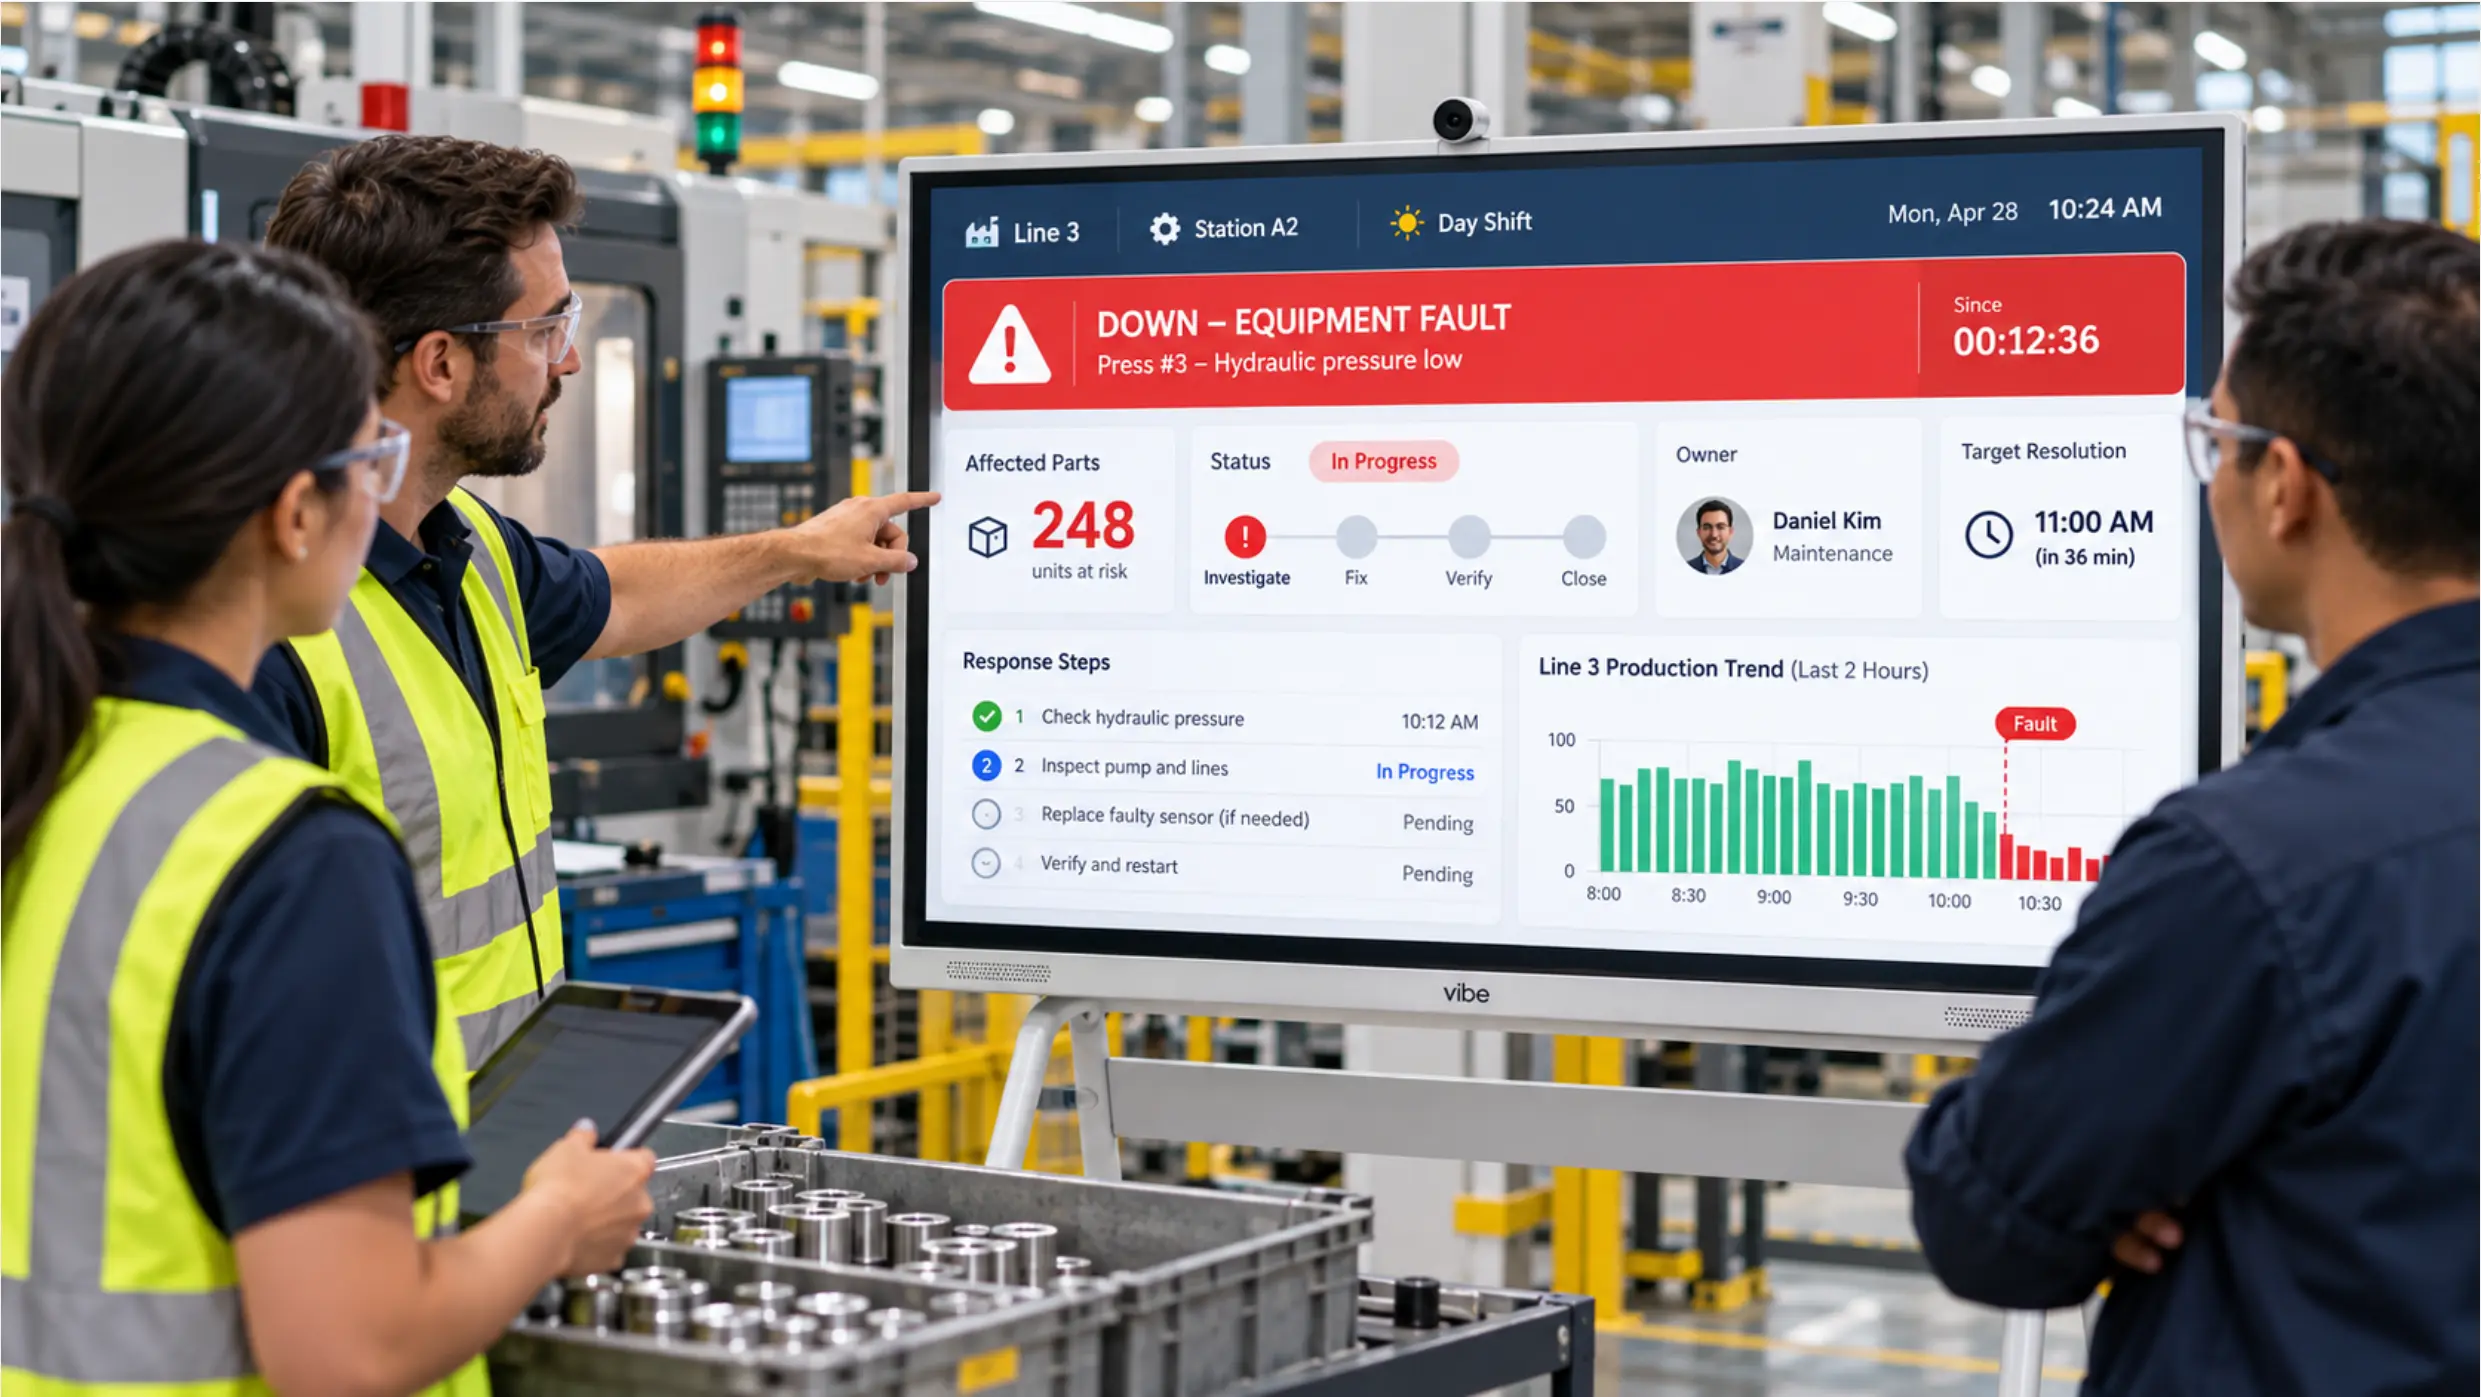 Manufacturing team reviewing equipment fault alert and production trend data on a Vibe Board in a factory setting
What Is a Digital Andon Board?
An andon board is a visual signaling tool used in lean manufacturing to communicate line status and production problems in real time. The term "andon" comes from the Toyota Production System, where colored lights — red, yellow, green — were mounted above production lines to indicate whether work was flowing, paused, or stopped.
A digital andon board replaces or supplements those physical light towers with a screen-based display connected to your actual production data. Instead of a single light state, a digital board can show:
-
Station-by-station status across multiple lines
-
Live output counts versus target pace
-
Downtime reason codes and duration
-
OEE components (availability, performance, quality)
-
Escalation status — who has been notified, and when
The shift from a physical andon light to a digital board isn’t just a visual upgrade. It’s a shift from manual signaling to automatic, data-driven alerts — and from reactive response to structured escalation.
Andon Board vs. Andon System: What’s the Difference?
These two terms are often used interchangeably, but they describe different scopes.
|
Term |
What it refers to |
|---|---|
|
Andon board |
The display itself — the screen or panel that shows line status |
|
Andon system |
The complete setup: display + data connection + alert triggers + escalation logic |
You can have an andon board without a full andon system (a static screen showing a frozen dashboard, for example). A complete andon system means the board updates automatically when thresholds are crossed, triggers notifications to the right people, and logs the event for later analysis.
For most manufacturers, the goal is the full system — but starting with the display layer and building escalation logic on top is a practical way to phase in the rollout.
What a Digital Andon Board Should Display
The best andon boards are designed around three questions the shift manager asks during every floor walk:
-
Is everything running? (Line and station status — green/yellow/red)
-
Are we on pace? (Actual output vs. target, takt time remaining)
-
What’s causing problems right now? (Active alerts, downtime reason codes, time since fault)
Beyond those core elements, well-configured andon boards typically include:
-
OEE or availability percentage per line, updated in real time
-
Escalation chain status — operator notified, supervisor en route, maintenance dispatched
-
Shift summary — cumulative output, total downtime, reject count
-
Quality flags — if integrated with inspection systems or manual reporting
 Annotated mockup of a Vibe Board S1 Pro screen showing andon board layout — station grid top half, KPI strip bottom half, active alert sidebar
What you display depends entirely on what data you can connect. A good starting point is whatever your MES, PLC, or OEE software already captures — you don’t need new sensors or new data to get started.
How a Digital Andon Board Works
Step 1 — Connect to Your Existing Data Sources
A digital andon board pulls from the production systems you already run. Common data sources include:
-
PLCs and machine controllers via OPC UA, MQTT, or Modbus
-
MES platforms (SAP, Epicor, Plex, Infor) via API or database query
-
OEE tracking tools (Vorne, Tractian, TeepTrak) via dashboard embed or API
-
Power BI or Tableau dashboards already showing production KPIs
-
Spreadsheets or manual data entry for plants not yet on a full MES
The key principle: you should be connecting a display layer to data that already exists, not building new data infrastructure just to run an andon board.
Step 2 — Define Alert Thresholds and Trigger Logic
An andon board without trigger logic is just a passive dashboard. The alert layer is what makes it an andon system.
Common triggers include:
-
Output falls below target pace by more than X% for Y minutes
-
Machine enters fault or downtime state for longer than a defined threshold
-
Quality rejection rate exceeds a set limit in a rolling window
-
Operator manually triggers an alert via a physical button or touchscreen tap
For each trigger, define the escalation chain: who gets notified, in what order, and how the alert is cleared.
Step 3 — Choose Your Display Hardware
The display itself needs to be visible across the production floor — typically a 55″ to 85″ screen mounted at eye level in a high-traffic area, or suspended overhead where sightlines permit.
Vibe Board S1 Pro works well in this role because it handles both the display and the interactive layer on a single device. A supervisor can walk up, tap to acknowledge an alert, pull up a secondary dashboard, or annotate the current shift status directly on the screen — without needing a separate control terminal.
For facilities with multiple lines, one large board covering the full floor is less effective than zone-based boards positioned near the lines they monitor. Operators shouldn’t have to walk to the far end of the building to check status.
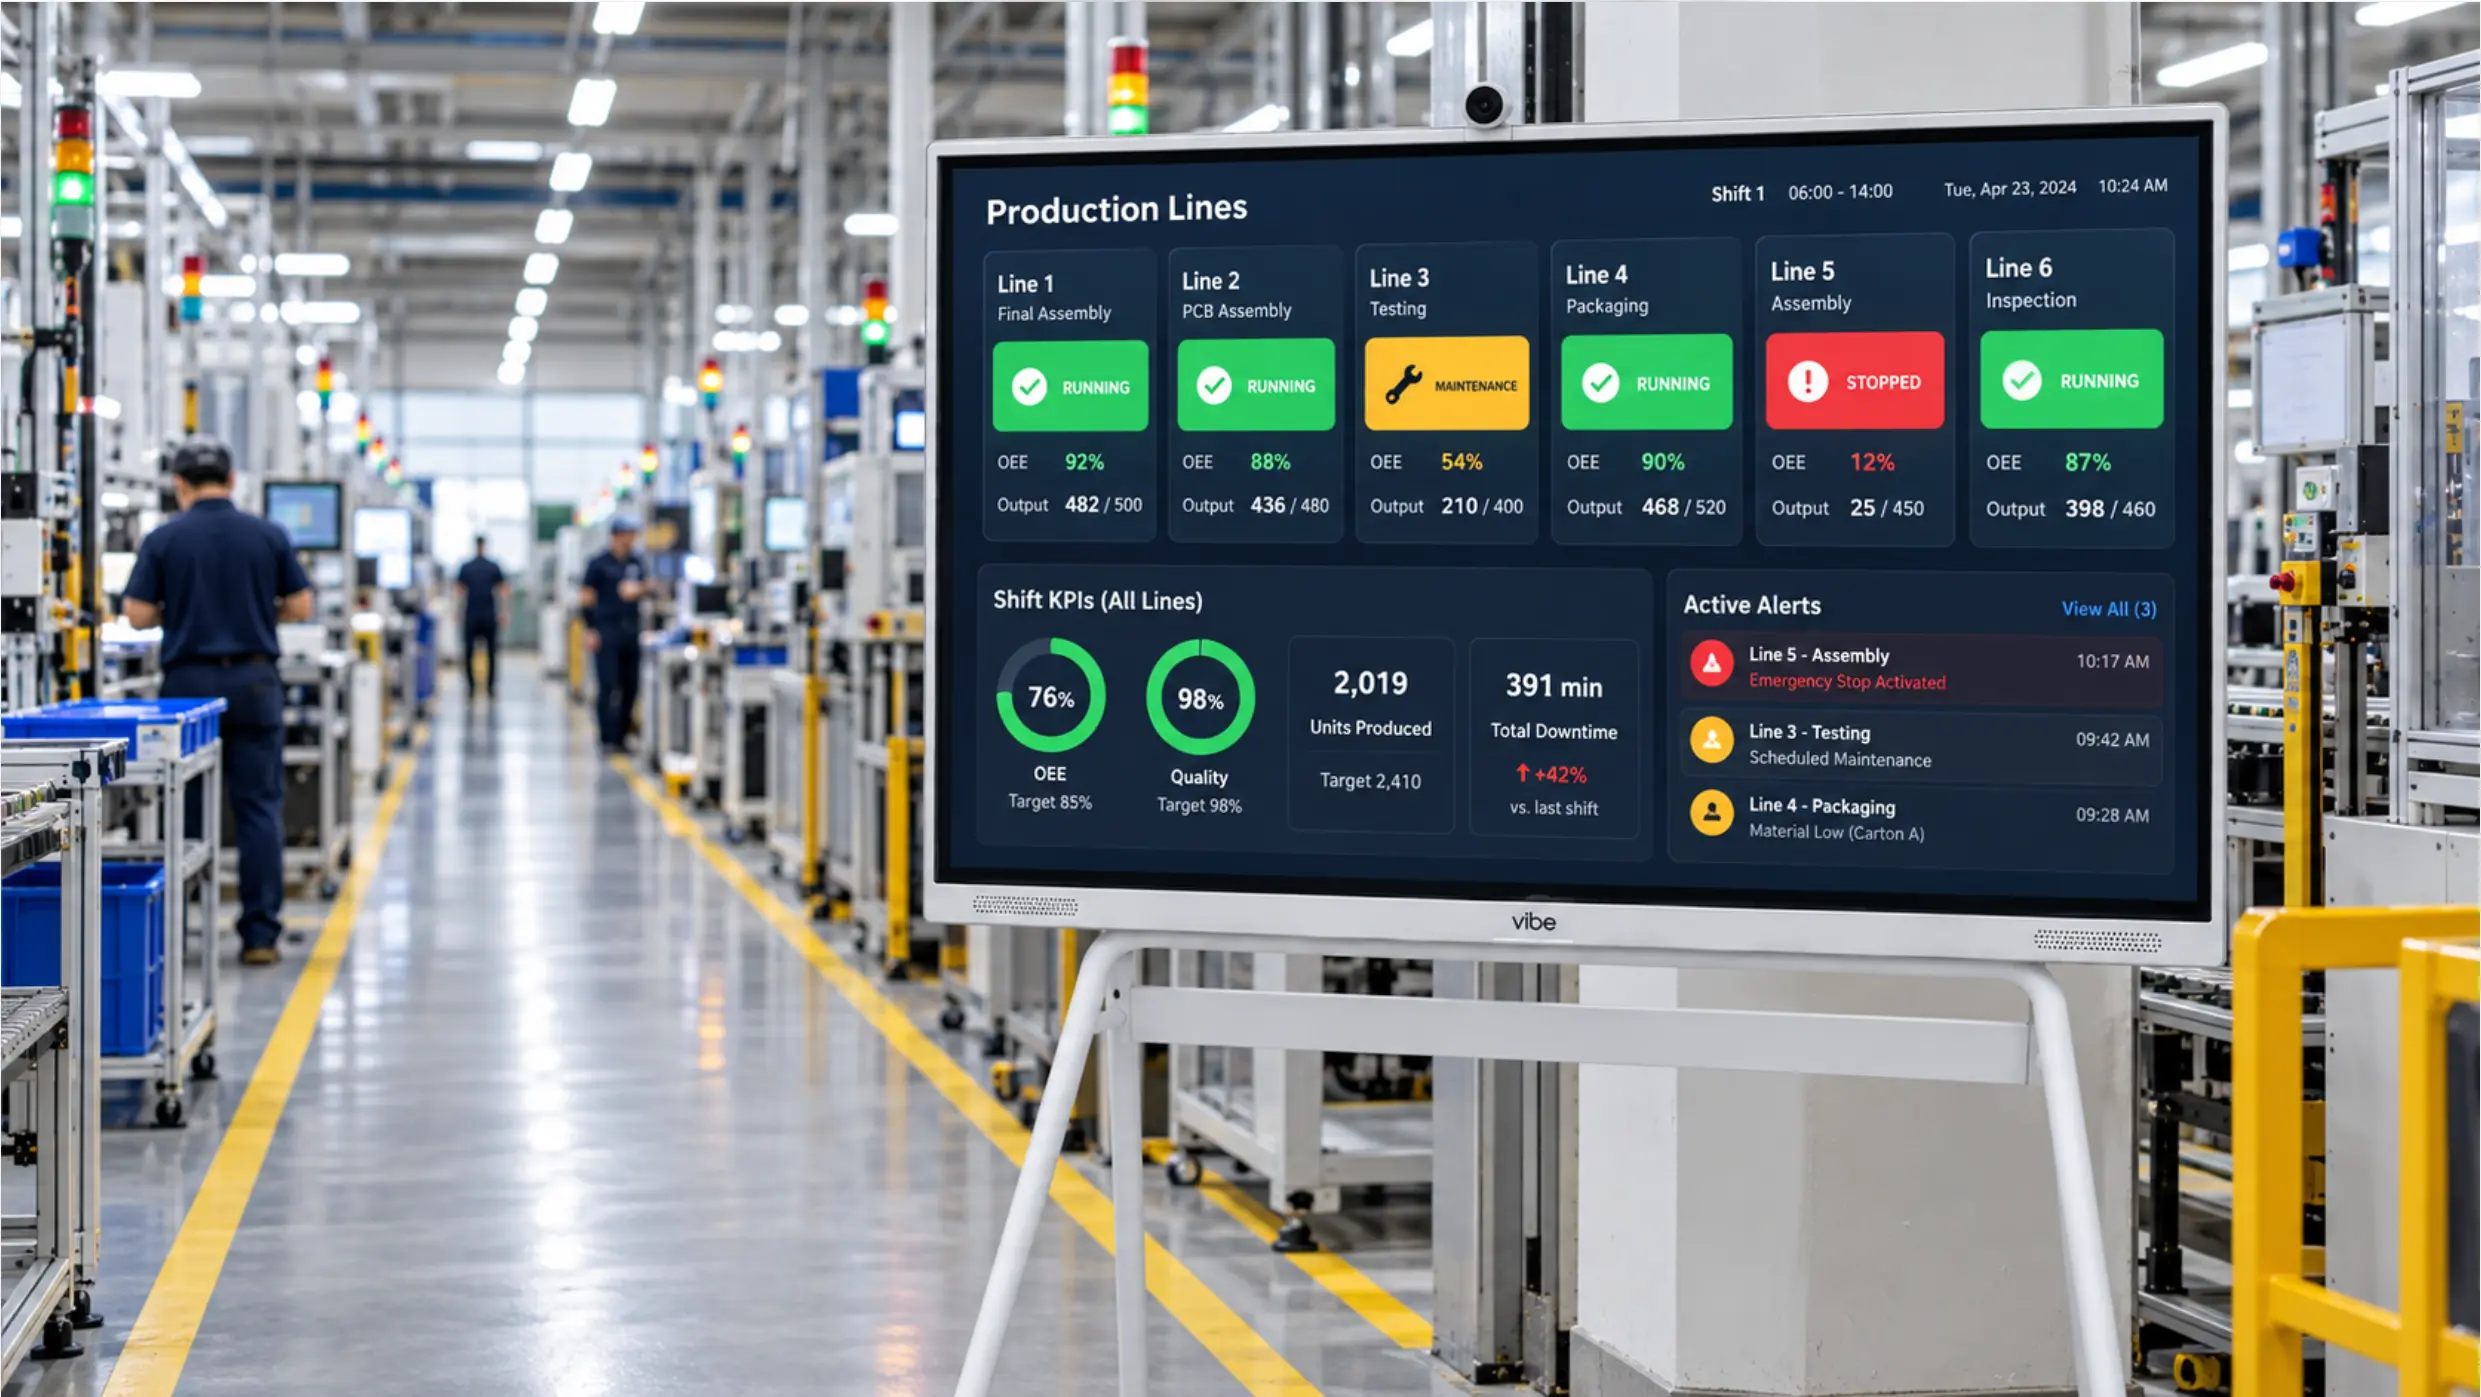 Vibe Board S1 Pro mounted at the end of a production aisle, displaying a multi-line andon board with color status indicators and shift KPIs
Step 4 — Configure the Layout for the Floor
An andon board is read at a distance, often while moving. Design principles that matter in practice:
-
High contrast — dark backgrounds, bright status colors; avoid pastels
-
Large text — station IDs and alert codes readable at 20+ feet
-
Status-first layout — traffic-light status grid visible at a glance before the reader reaches the fine data
-
Minimal clutter — six to eight status blocks per screen is readable; twenty is not
Most andon board software includes templates. Adjust for your floor layout, line naming convention, and the KPIs your supervisors actually use during shift reviews.
Step 5 — Pilot, Review, Iterate
Roll out on one line first. Run for two to four weeks. Then ask:
-
Are the alert thresholds catching real problems, or generating noise?
-
Are supervisors using the board to make decisions, or ignoring it?
-
What’s missing from the display that comes up in every shift debrief?
Adjust before expanding to other lines. An andon board that operators trust and supervisors actually reference is worth more than a technically complete system that no one looks at.
Vibe vs. Dedicated Andon Software Platforms
Platforms like Peakboard, TeepTrak, Vorne, and Fabriq are purpose-built andon and OEE systems. They include data connectors, alert logic, and dashboard templates designed specifically for manufacturing environments. If you need deep machine integration, automated escalation workflows, and structured downtime coding, those platforms are built for that job.
Vibe Board S1 Pro fits a different scenario: you already have the data in Power BI, your MES, or another dashboard tool, and you need a reliable large-format screen to display and interact with it on the floor — without deploying another software platform or locking into a subscription model.
The distinction matters when choosing your setup:
|
Scenario |
Better fit |
|---|---|
|
Need automated alert escalation, downtime coding, or deep PLC integration |
Purpose-built andon platform (Peakboard, TeepTrak, Vorne) |
|
Have existing dashboards and need floor-level display + interactive access |
Vibe Board S1 Pro as the display layer |
|
Both — structured data platform + flexible display hardware |
Andon software feeding into a Vibe Board screen |
Many plants use both: a software platform handles the data logic, and Vibe Board handles the physical display at the line.
Common Questions About Digital Andon Boards
How is a digital andon board different from a traditional andon light?
A traditional andon light signals a single state — typically red, yellow, or green — and is usually triggered manually by an operator. A digital andon board connects to production data automatically, displays multiple KPIs simultaneously, and can trigger escalations to supervisors or maintenance teams without operator action.
Do I need new sensors or data infrastructure to run an andon board?
Not necessarily. Most digital andon boards connect to data sources that already exist in your plant — MES systems, PLC outputs, OEE platforms, or even live Excel or Power BI reports. The display layer is separate from the data collection layer. If your production data is already being captured somewhere, the board visualizes it; it doesn’t replace it.
What’s the difference between an andon board and an OEE dashboard?
They serve related but distinct purposes. An OEE dashboard summarizes production efficiency over a time period (a shift, a day) and is primarily a retrospective analysis tool. An andon board is real-time and operational — it shows what’s happening right now and triggers action when something is wrong. Many facilities run both: the andon board for live response, the OEE dashboard for shift review and trend analysis.
How many lines can one andon board cover?
It depends on the screen size and how much detail you display per line. A 75″ screen can legibly show six to eight lines with status, output, and a basic alert indicator. For larger facilities, zone-based boards — one per production area — tend to work better than a single board trying to cover the full floor.
Can operators trigger andon alerts manually, or is it always automated?
Both approaches are valid and often used together. Automated triggers fire when data thresholds are breached (line stops, OEE drops). Manual triggers — via a physical button, a touchscreen tap, or a tablet app — allow operators to escalate quality issues, material shortages, or safety concerns that sensors can’t detect. Most effective andon systems support both.
What does it cost to set up a digital andon board?
Costs vary widely. A software-only setup using an existing screen and a cloud dashboard might cost a few hundred dollars per month. A dedicated andon platform with machine integration (Peakboard, TeepTrak) typically starts in the low thousands per line. A Vibe Board S1 Pro with a browser-based or Power BI dashboard display runs as a one-time hardware cost without an ongoing per-seat software subscription, making it cost-effective when you already have the data platform.
Setting Up an Andon Board: A Practical Checklist
Before going live, confirm you have the following in place:
-
Data source identified and accessible (MES, PLC, OEE platform, or Power BI report)
-
Alert thresholds defined for each production condition you want to monitor
-
Escalation chain documented (operator → supervisor → maintenance → management)
-
Display hardware mounted at the right height and viewing distance for the floor
-
Layout tested at actual viewing distance — status readable without walking closer
-
Pilot line selected and baseline downtime data captured pre-launch
-
Review cadence scheduled for the first 30 days post-launch
What to Expect After Launch
In the first weeks, expect some noise. Alert thresholds that seemed reasonable on paper often need adjustment once real shift data comes in. Supervisors may initially ignore the board until they see it catch a real problem faster than their floor walk would have.
The metric to watch isn’t how often the board shows green — it’s mean time to acknowledge an alert. If that number drops from 12 minutes (floor walk discovery) to 2 minutes (board-triggered response), the board is working. That reduction, multiplied across shifts and lines, is where the ROI lands.
Facilities that treat the andon board as a living system — adjusting thresholds, adding lines, incorporating shift review data — get compounding returns over time. Facilities that deploy it once and leave it untouched tend to see it fade into the background.
Summary
A digital andon board connects your existing production data to a shared floor display, making line status and alerts visible to everyone in real time. Getting one running doesn’t require replacing your MES, installing new sensors, or deploying another software platform — it requires identifying what data you already have, setting alert thresholds that match your production conditions, and putting a screen where operators and supervisors can actually see it.
The setup is straightforward. The ongoing work is calibration. And the result — faster response times, structured escalation, and a floor culture that acts on data instead of waiting for the floor walk — is measurable within the first month.
Frequently Asked Questions
What is an andon board in manufacturing?
An andon board is a visual display tool used in lean manufacturing to communicate production line status in real time. Traditional andon boards used colored lights; digital versions display live data including station status, output vs. target, downtime reason codes, and alert conditions on a shared screen.
How does a digital andon system work?
A digital andon system connects to production data sources (PLCs, MES, OEE platforms, or dashboards), displays current status on a floor screen, and triggers escalation alerts when defined thresholds are crossed — automatically notifying the right people without waiting for a supervisor’s next floor walk.
What should an andon board display?
At minimum: station status (running / stopped / alert), current output vs. target, and active alerts with elapsed time. More complete boards add OEE metrics, downtime reason codes, escalation chain status, and shift-level summaries.
Can I use a regular screen for an andon board?
Yes — any large-format display connected to a browser-based dashboard or BI tool can serve as an andon board. Vibe Board S1 Pro adds touch interactivity, so supervisors can acknowledge alerts, annotate shift data, or pull up secondary dashboards without needing a separate control device.
What’s the first step to setting up a digital andon board?
Identify what production data you already have and where it lives — your MES, OEE platform, or Power BI report. The display layer connects to that data; you don’t need to build new data infrastructure first. From there, define your alert thresholds and pick a pilot line to start.