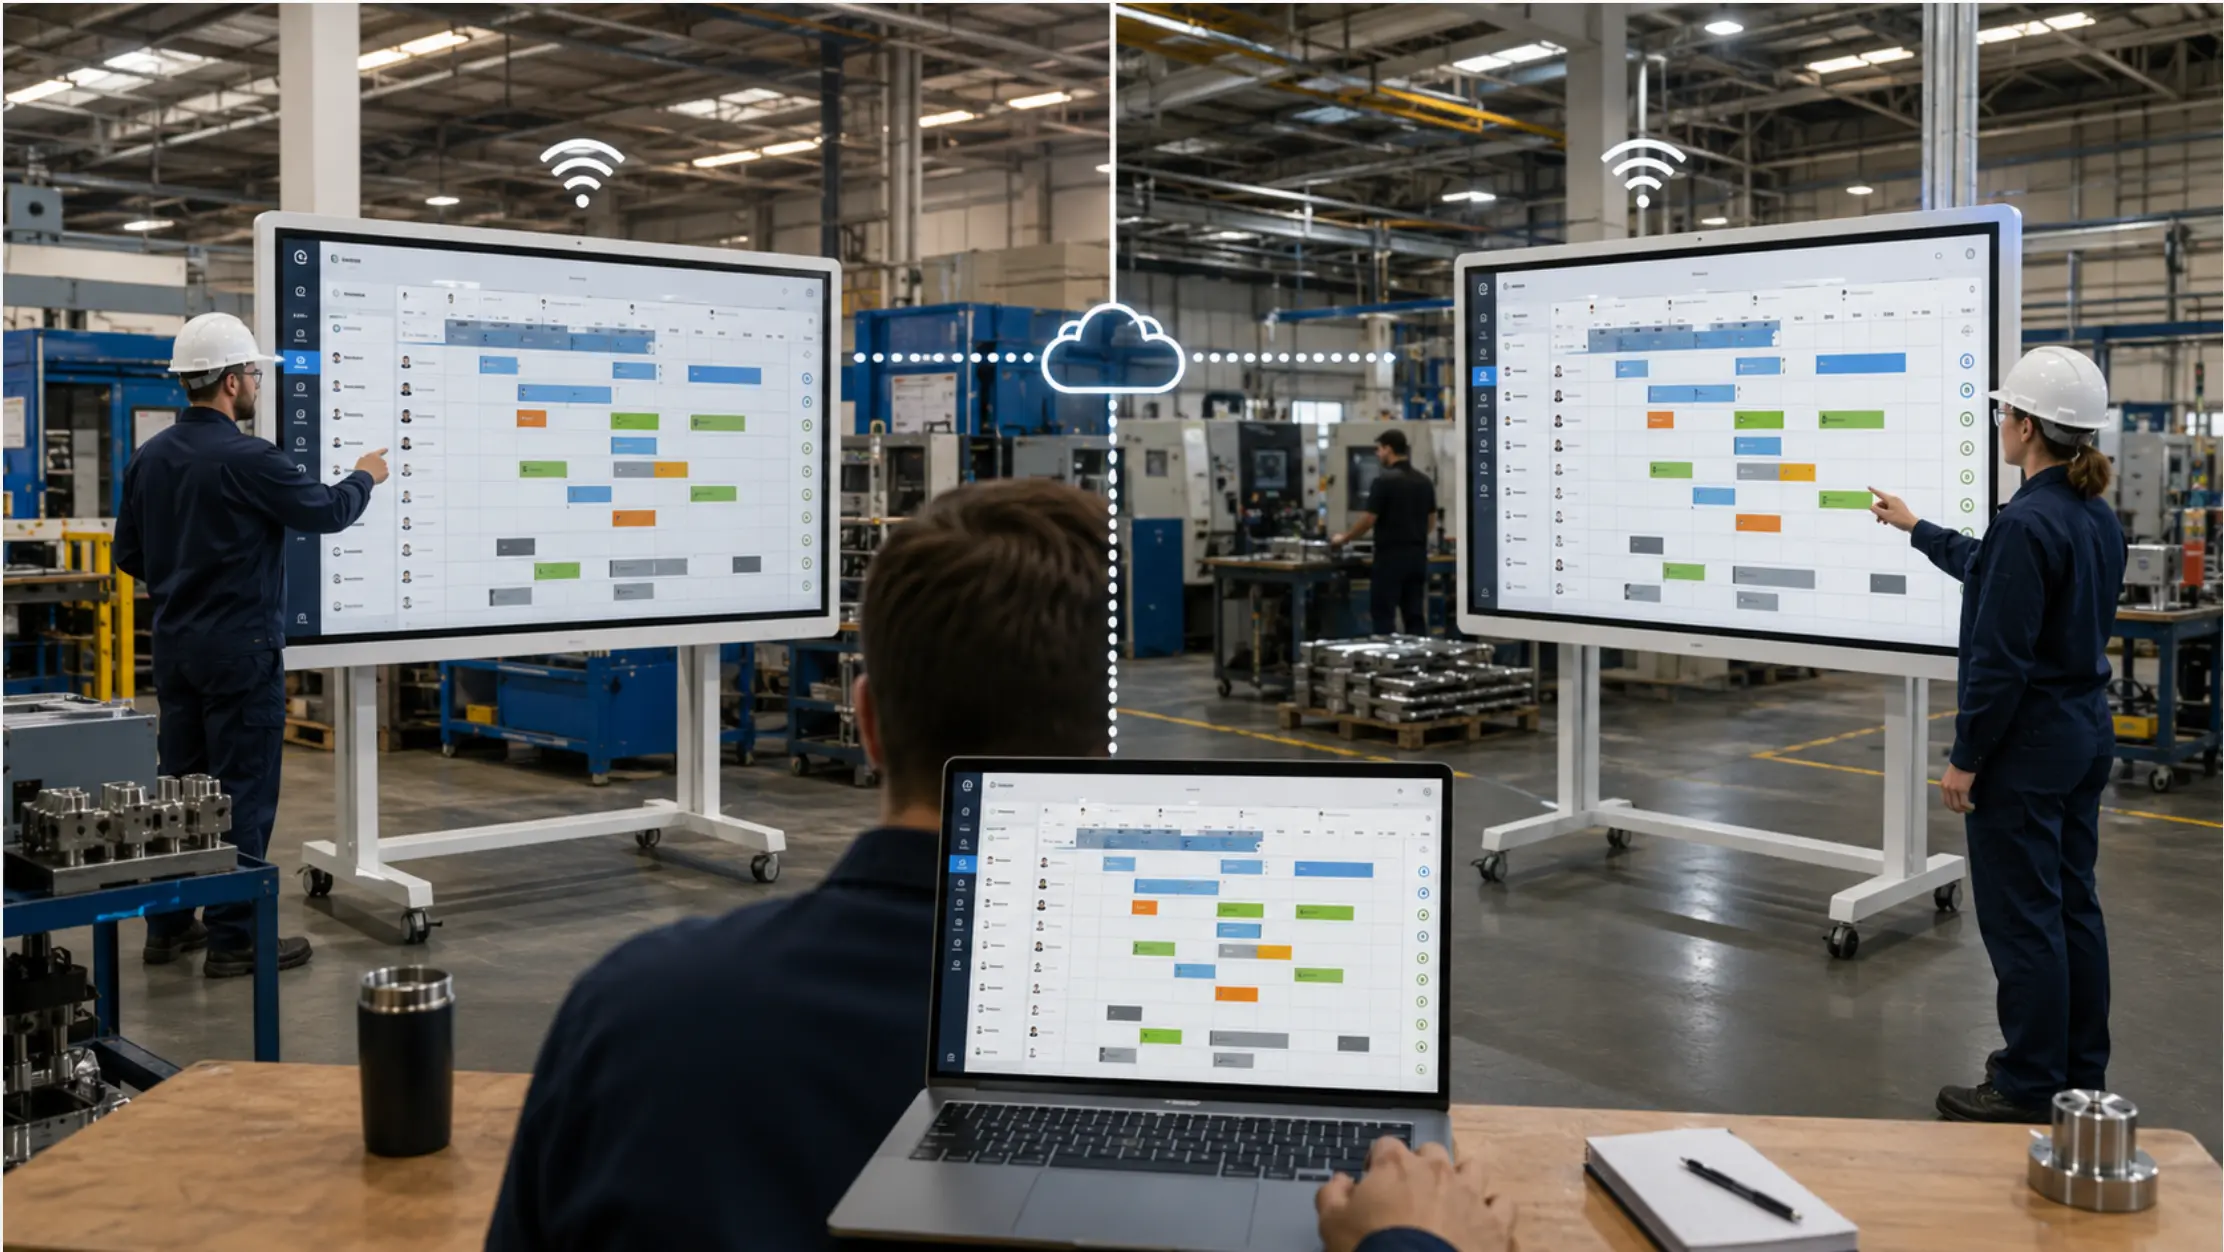

The SQDCP board — Safety, Quality, Delivery, Cost, People — is one of the most widely used daily management frameworks in manufacturing. As Workerbase’s guide to SQCDP describes it, the framework is a visual management methodology rooted in lean manufacturing principles, designed to measure, monitor, and improve performance across five core areas at once. It appears under several variations of the same acronym: SQCDP, SQDC, SQDCM, and others, reflecting the fact that different organizations weight the categories differently and sometimes substitute or add a fifth column. The underlying structure is the same: five (or four, or six) categories that represent the critical dimensions of the operation, tracked daily against targets, visible to the team running the shift.
Physical SQDCP boards are effective when they are maintained. The problem is the maintenance. Each of the five categories requires someone to update it — typically before the daily meeting, sometimes between meetings when conditions change. When maintenance lapses, the board becomes a record of last week’s performance displayed as if it were this week’s. A team that stops trusting the board stops using it, and the daily management rhythm it was meant to support dissolves back into verbal updates and email chains.
Digitizing an SQDCP board addresses the maintenance problem. But the risk of digitization — specific to this tool — is replacing a straightforward physical board with a platform that requires more work to maintain, not less. This article covers how to build a digital SQDCP board using tools most manufacturing teams already have, and how to connect live data sources where they exist to reduce the daily manual update burden.
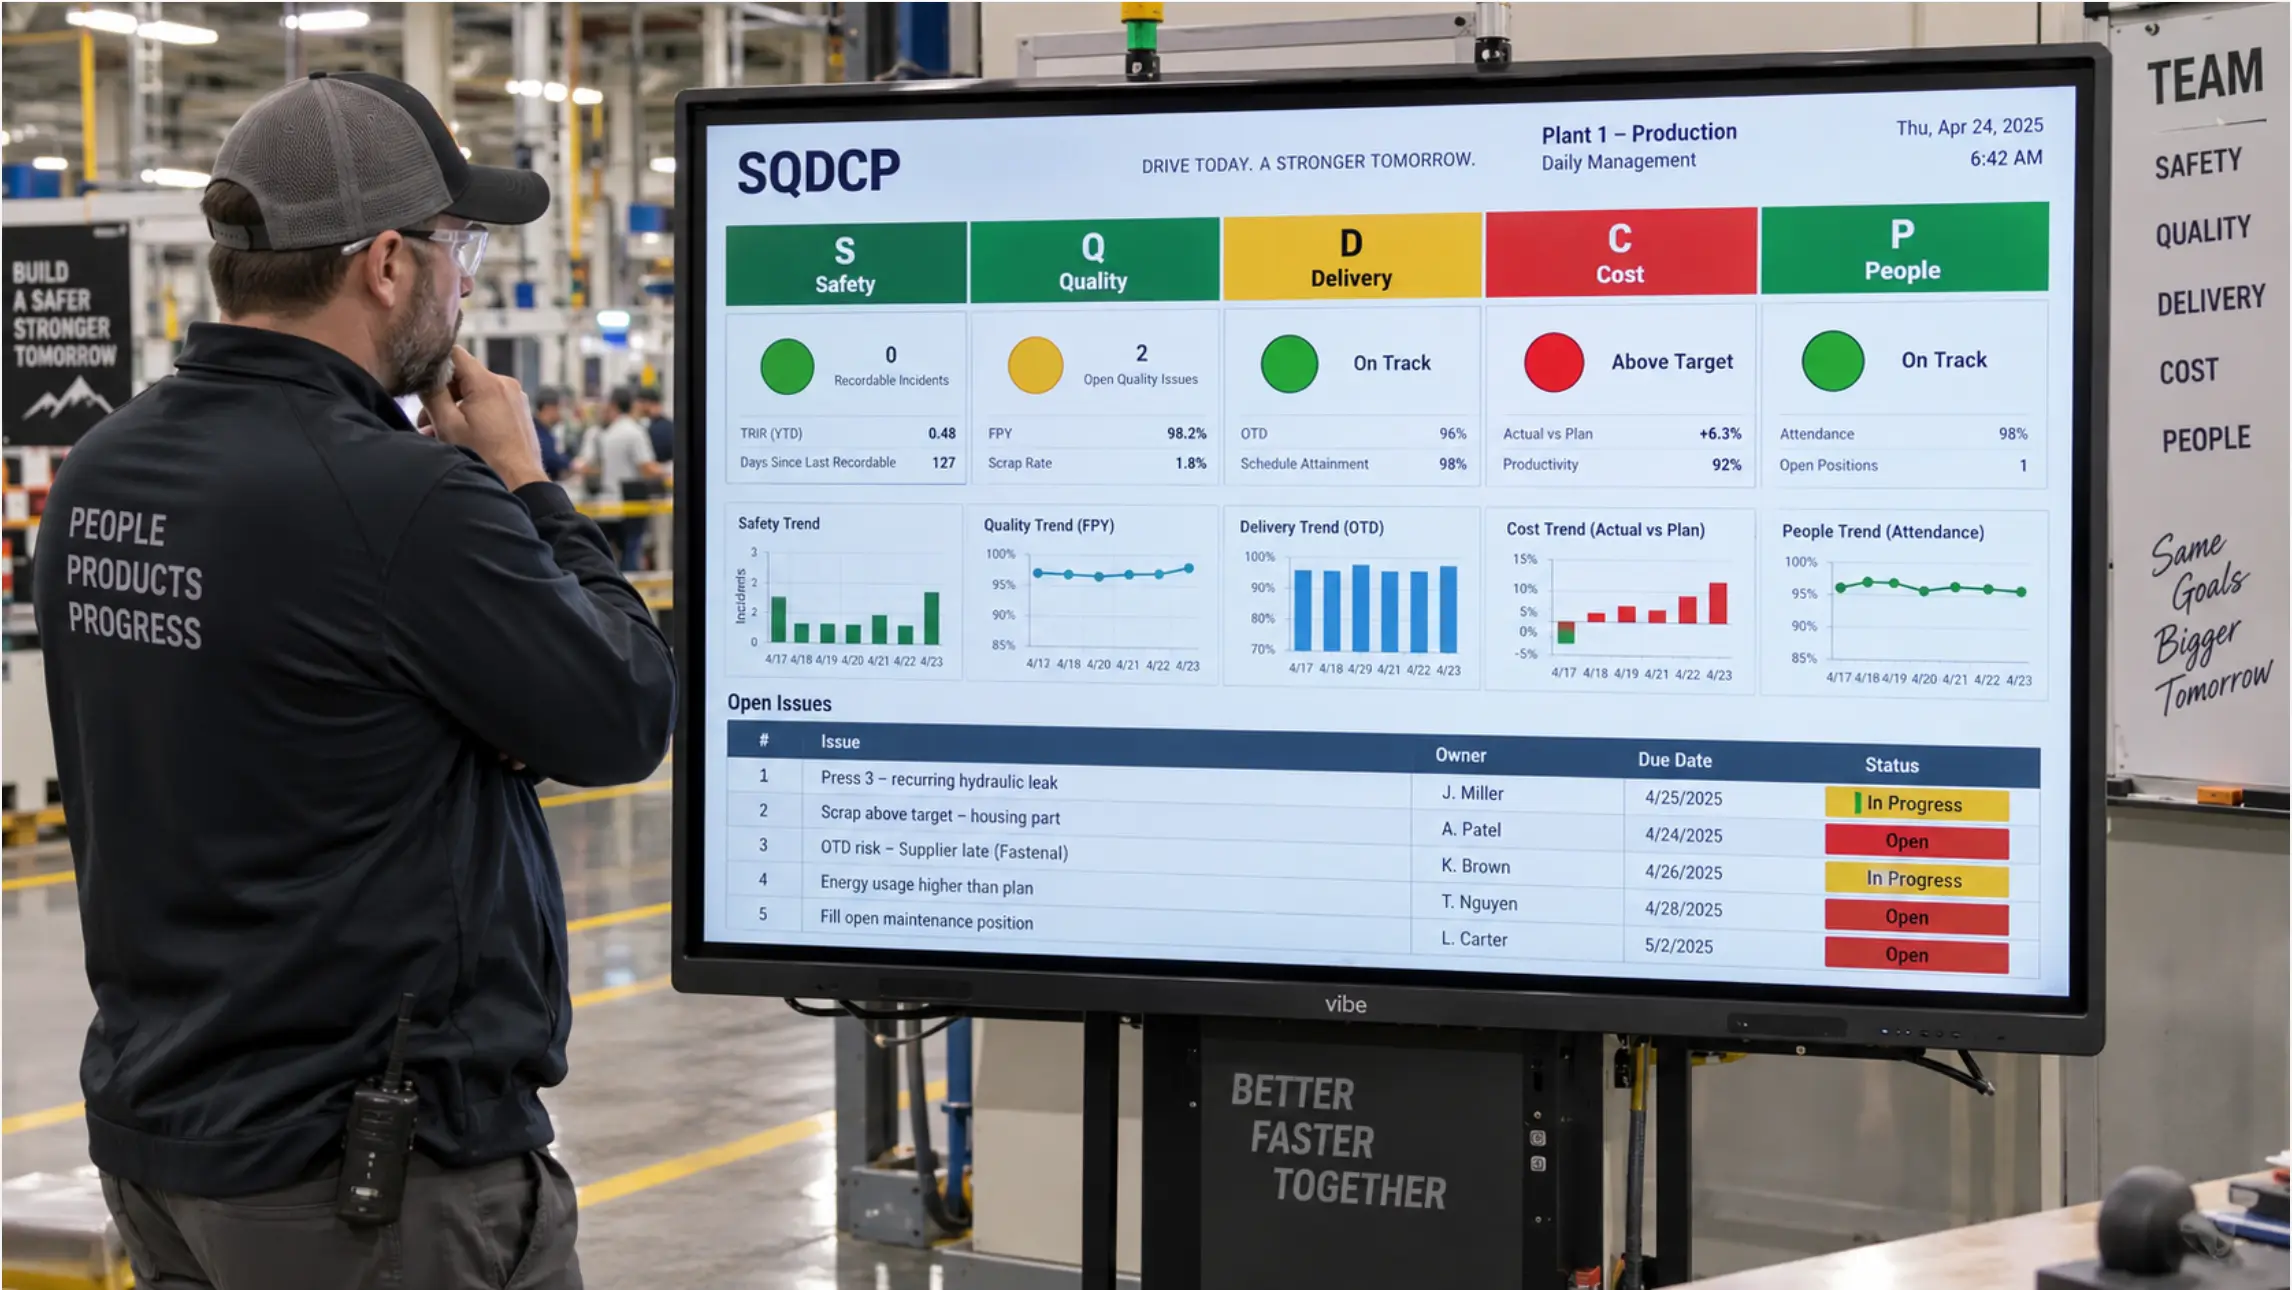 A Vibe Board showing a digital SQDCP board layout, a trend section below, and an open issues table — a shift supervisor reviewing it before the daily standup
What the SQDCP Board Is Tracking
Each column on an SQDCP board represents a different dimension of the operation, and each has a different update rhythm and a different source of data.
Safety tracks workplace safety events — incidents, near misses, unsafe conditions reported — against a target of zero. Safety data is typically event-driven rather than continuous: the column updates when something happens, not on a fixed schedule. Most organizations also track a running count of days without a recordable incident.
Quality tracks product or process quality metrics — defect rate, first-pass yield, customer complaints, open non-conformances. The specific metric depends on the operation. Quality data may come from a QMS, from inspection records, or from a manually maintained count.
Delivery tracks output performance — units produced versus target, on-time delivery, line attainment. Delivery is often the most data-rich column, with metrics that update continuously through the shift from ERP or production tracking systems. According to SCW.ai’s SQCDP implementation guide, digitizing the Delivery column with live ERP connections is where digital SQDCP boards deliver the most immediate reduction in manual update burden.
Cost tracks financial efficiency metrics — labor hours versus standard, material waste, downtime costs. Cost data typically comes from ERP and may update on a day-lag rather than in real time, depending on how the organization closes out shift records.
People tracks workforce metrics — attendance versus planned, training completions, open issues raised by operators. People data is almost always manually maintained, entered by the supervisor or HR based on the day’s actual attendance and activities.
Understanding which columns have live data sources and which require manual input is the starting point for building a digital board that is genuinely easier to maintain than the physical version.
Why Physical SQDCP Boards Fail Between Meetings
The failure mode for physical SQDCP boards is predictable: they are accurate for the ten minutes before the daily meeting and increasingly stale for the rest of the day.
The update is a single person’s job. In most plants, the supervisor or team leader updates the board before the meeting. If that person is pulled to a different problem, the board does not get updated. If they leave early, the board stays at morning values through the afternoon shift. The board’s currency depends entirely on one person’s availability and discipline.
Mid-shift changes are not reflected. When a line goes down mid-shift and output falls below target, the Delivery column on the physical board still shows the morning’s projection. The board becomes misleading rather than informative — the team knows the situation has changed, but the board does not reflect it.
The five-column format requires five separate updates. Even a disciplined team maintaining all five columns faces a non-trivial update burden. Safety, Quality, Delivery, Cost, and People each need their own data, from their own sources, entered manually into the board. Multiply that across shifts and days, and the board becomes the most time-consuming part of daily management — which is the opposite of what it is supposed to be.
Building the Digital SQDCP Board in Excel
The most practical starting point for most manufacturing teams is an Excel template stored in SharePoint — the same tool the team already uses, in a shared location that any connected device can open and update.
The template structure. One worksheet as the display view: five category columns across the top, with rows below each column for the day’s metrics, current status, and a color-coded performance indicator. A second worksheet holds the data entry view — a simpler layout where the supervisor enters or updates values, and formulas in the display view pull the results automatically. A third worksheet holds the trend data — weekly or monthly performance by category — for the weekly review.
Separating the data entry view from the display view is important. The display view is optimized for readability at floor scale: large fonts, clear status indicators, no formulas visible. The data entry view is optimized for the person updating the board: labeled fields, input validation, simple dropdowns. The supervisor updates the data entry view; the display view updates automatically.
Color coding with conditional formatting. Each category’s status indicator uses a three-color system: green for on target, amber for within an acceptable variance, red for below threshold. Conditional formatting applies the color automatically based on the values entered — the supervisor does not have to remember which color to assign. The thresholds for each color are set in the data entry view and can be adjusted without touching the display formatting.
The open issues section. Below the five-column metrics display, an open issues table shows problems raised during recent meetings or shifts that have not yet been resolved. Each row shows the issue, the category it belongs to, the owner, the date raised, and the current status. This table is updated during the daily meeting — items added as they are raised, closed when resolved. It is the accountability mechanism that converts the daily meeting from a status review into a problem-solving session.
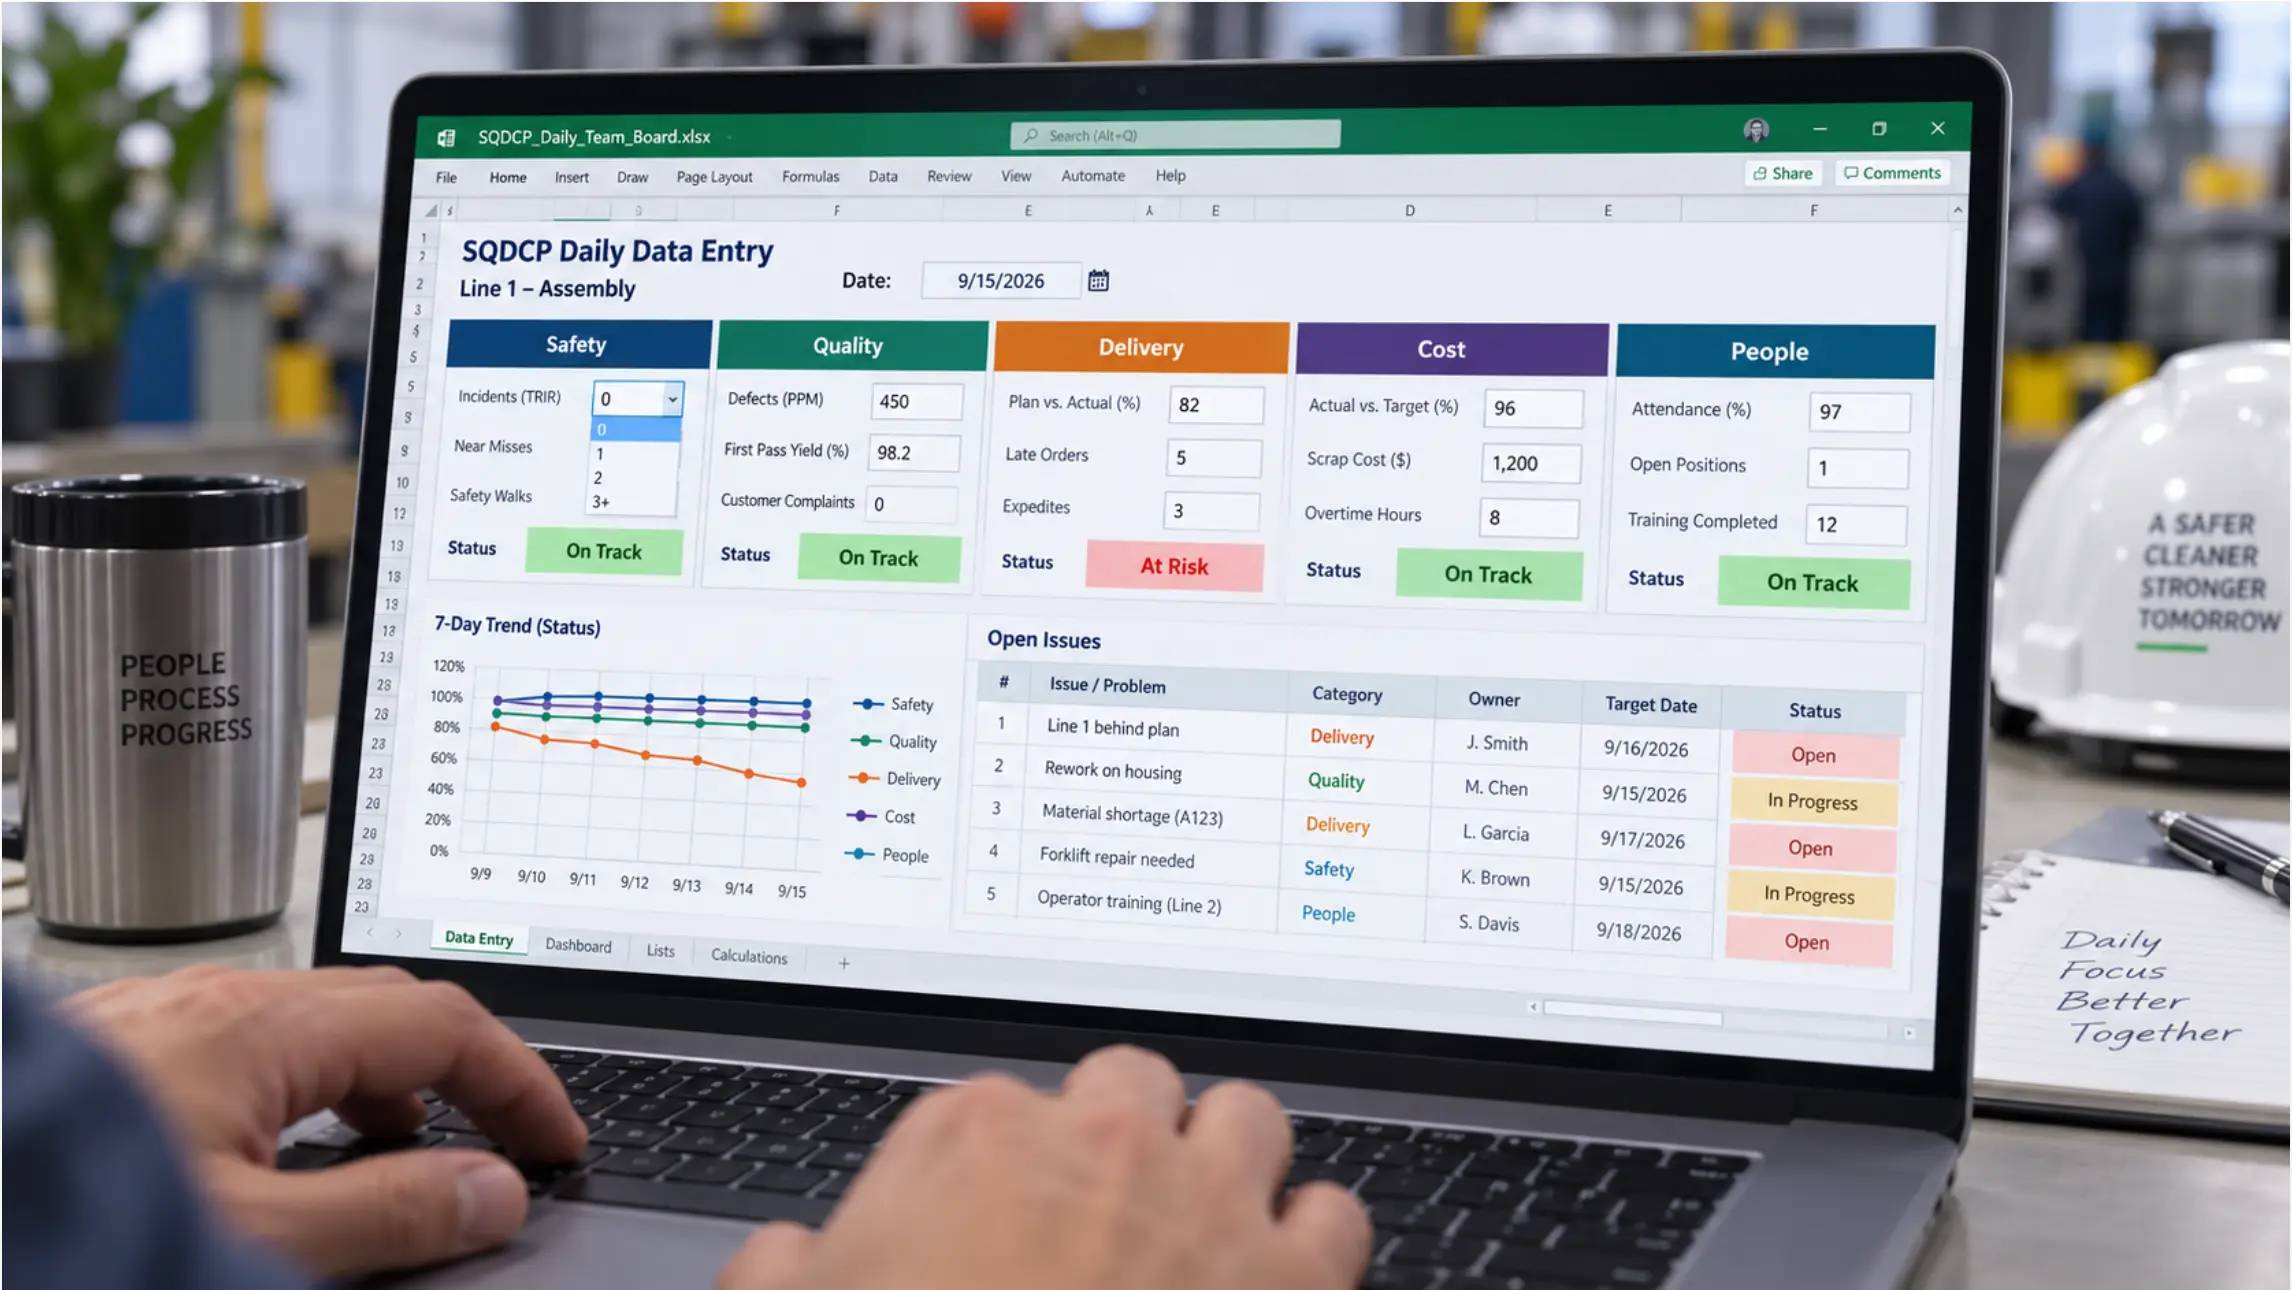 Close-up of the Excel SQDCP template data entry view on a laptop screen
Connecting Live Data Sources
Not every SQDCP column needs to be updated manually. Where live data sources exist, connecting them to the Excel template removes the manual step for that column.
Delivery from ERP. If production output is tracked in an ERP system that exports to Excel or supports a data connection, the Delivery column’s actual value can pull from that source directly. The supervisor does not enter the output figure — it appears automatically when the file refreshes. For teams already using SAP or similar systems with Excel integration, this is an extension of an existing workflow.
Quality from a QMS. If defect counts or first-pass yield are maintained in a quality management system with a reporting export, those figures can feed the Quality column on the same schedule. The lag depends on how frequently the QMS updates — real-time for systems with live operator input, shift-end for systems where results are entered at inspection.
Safety and People remain manual. Safety events are not the kind of data that should be automated from a system — they require human judgment to categorize and enter. People metrics — attendance, training completions — similarly require supervisor input. The digital format makes these easier to enter (a tap on a dropdown, a number in a field) but does not eliminate the manual step.
The practical result of connecting the columns that have live sources: the supervisor’s daily update burden shrinks from five columns to two or three. The board becomes current on delivery and quality without anyone doing anything; the supervisor adds the safety and people data, and the full picture is up to date.
Displaying the Board at Floor Level
The display choice determines whether the digital SQDCP board becomes a room fixture or a meeting-only tool.
A TV showing a screenshot of the board, updated manually by casting a laptop, replicates the physical board’s staleness problem in digital form. The board is current when someone is actively managing it; at all other times it shows whatever was last cast. This is the same failure mode that affects physical visual management boards across manufacturing generally — the display depends on a person rather than a live source.
A purpose-built interactive display running Windows connected to SharePoint opens the Excel template directly and keeps it current without active management. When the supervisor updates the data entry view from a laptop or a tablet, the display view on the floor board updates immediately. When a data connection to the ERP refreshes the Delivery column, the board on the floor reflects the change. No one has to push an update to the display.
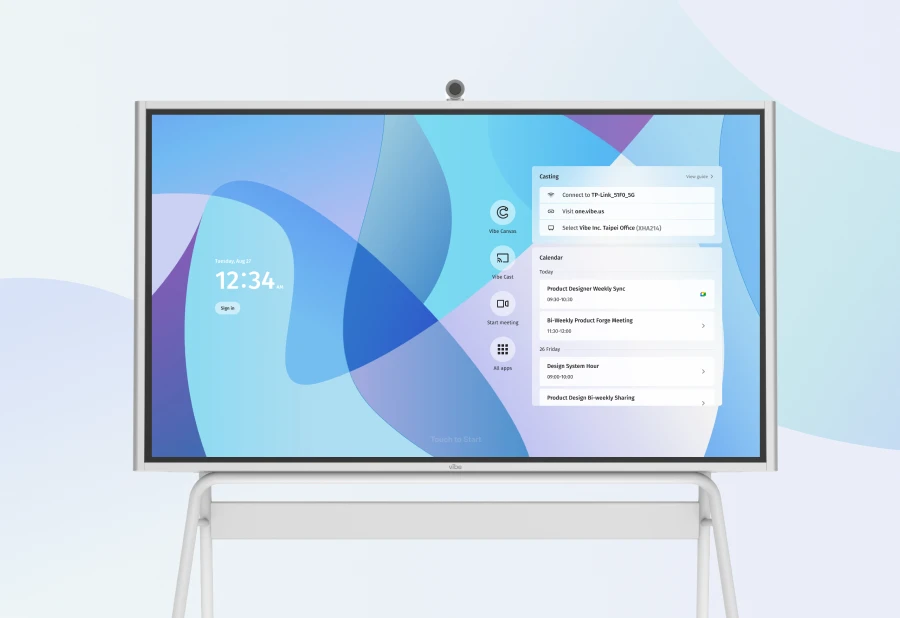
The Vibe Board S1 Pro connects to SharePoint and OneDrive using the team’s existing Microsoft 365 credentials. The SQDCP template opens from the shared folder, stays on the display between shifts, and allows the supervisor to update values or add an issue to the open issues table directly on the touchscreen during the meeting — with changes saving back to SharePoint immediately.
For the daily meeting, the board is on before anyone arrives. For the shift team that passes the board on the way to their stations, the current performance is visible without anyone having to pull it up. That passive visibility — the ability to see the operation’s status without asking or opening a system — is what makes the SQDCP board useful beyond the ten minutes of the meeting.
When a Dedicated Platform Is the Right Call
The Excel and SharePoint approach described here handles the display, update, and basic tracking requirements for most SQDCP implementations. It is not the right fit for every situation.
A dedicated lean daily management platform (Boards on Fire, Workerbase, DigiLEAN, and similar tools) makes sense when:
-
Cross-site standardization is required. If the same SQDCP structure needs to be enforced across ten plants, with central visibility into all sites’ performance, a dedicated platform with a standardized data model is more manageable than ten independently maintained Excel files.
-
Automated escalation is needed. If an issue that stays red for more than a defined period needs to automatically notify a manager or escalate to the next tier, a platform with workflow automation is required. Excel conditional formatting changes colors; it does not send notifications.
-
Audit trails are a compliance requirement. If the SQDCP board’s history needs to be preserved as an auditable record — with timestamps, change logs, and user attribution — a dedicated system provides this; a shared Excel file does not.
For teams not yet at these thresholds, the Excel approach is faster to deploy, cheaper to maintain, and easier to adapt as the team’s needs evolve. It is also a useful foundation for understanding what the team actually needs before committing to a platform: after six months of running a digital board in Excel, the gaps become clear, and those gaps become the requirements for any platform evaluation.
The Board That Gets Used Is the One That Stays Current
An SQDCP board that the team trusts is one that is always current — not just before the meeting, but between meetings, across shifts, and for people who are not in the building.
The digital version gets there by reducing the manual update burden to the minimum: connecting the columns that have live data sources, simplifying the entry of the columns that do not, and keeping the display on and visible without anyone having to manage it. When those conditions are met, the board becomes part of the ambient information environment of the operation — something the team reads as naturally as they read the clock.
Request a demo to see how an SQDCP board runs on the Vibe Board S1 Pro using your existing Excel and SharePoint files, or request a quote if you are ready to deploy.
Frequently Asked Questions
Is the correct acronym SQDCP or SQCDP?
Both are used in practice, and neither is universally "correct." The most common version places Cost and Delivery in different positions — SQCDP (Safety, Quality, Cost, Delivery, People) is slightly more common in the literature, but SQDCP (Safety, Quality, Delivery, Cost, People) is also widely used. Some organizations use SQDC (dropping People), SQDCM (replacing People with Morale), or other variations. The specific letter order matters less than the consistency of the framework within your organization.
How many metrics should each category have?
Lean practitioners generally recommend limiting each category to one or two primary metrics — the ones that most directly indicate whether the category is performing to standard. A Safety column with one metric (days without a recordable incident) is more readable and more actionable than one with six safety-related figures. The goal is a board where any team member can tell at a glance whether each category is green or red — not a comprehensive dashboard of everything the operation tracks.
What is the right update frequency for the board?
For the metrics section, once per shift is sufficient for most operations — updated before the daily meeting, with live data connections refreshing automatically where they exist. For the open issues section, updates should happen whenever an issue’s status changes — not on a fixed schedule. The board should always reflect the current state of open problems.
How do we handle the board across multiple shifts?
A separate tab per shift in the same Excel file is the most common approach — one tab for Day shift, one for Afternoon, one for Night. The display view shows the active shift’s tab. Each incoming supervisor updates their shift’s tab at the start; each outgoing supervisor closes out their tab at shift end. A summary tab can roll up the day’s performance across all shifts for the manager’s review.
What happens to closed issues?
Closed issues can be moved to an archive section of the open issues table rather than deleted — keeping the history visible for trend analysis without cluttering the active view. A monthly review of the archive shows which categories generate the most recurring issues and whether resolved items stay resolved.
How is an SQDCP board different from a Gemba board?
They serve related but distinct purposes. A Gemba board is specifically designed for in-situ observation during a walk — it is placed at a specific work area and reviewed by a manager walking through. An SQDCP board is typically a more comprehensive daily management tool used in a structured daily meeting, covering a department or plant-level set of metrics. In practice, many organizations use the SQDCP framework as the structure for both their daily meeting board and their Gemba walk boards — the formats overlap significantly.